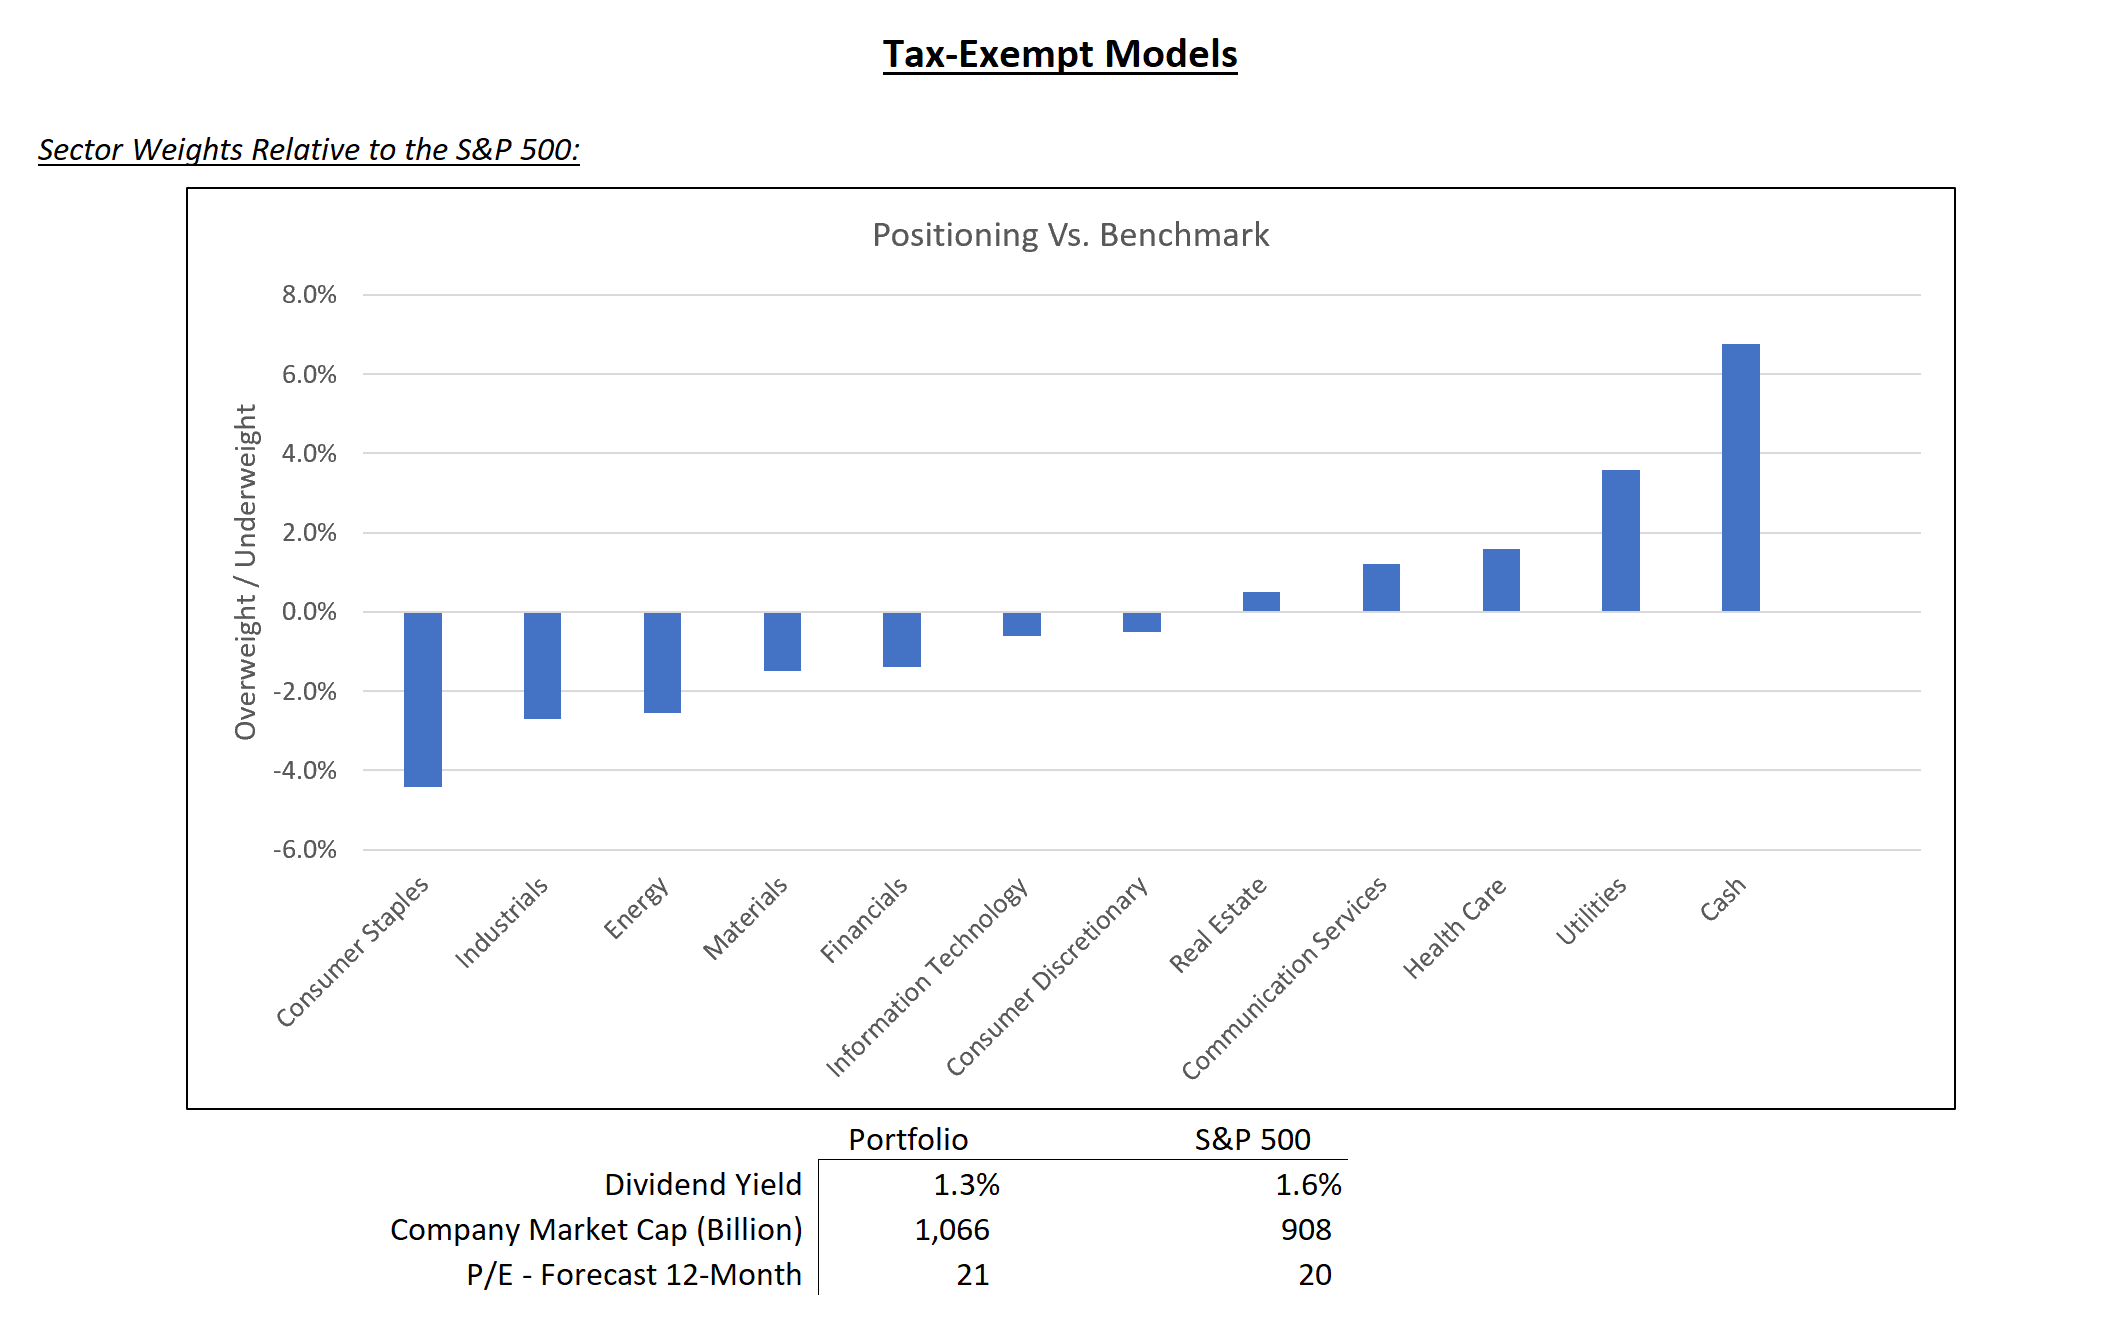
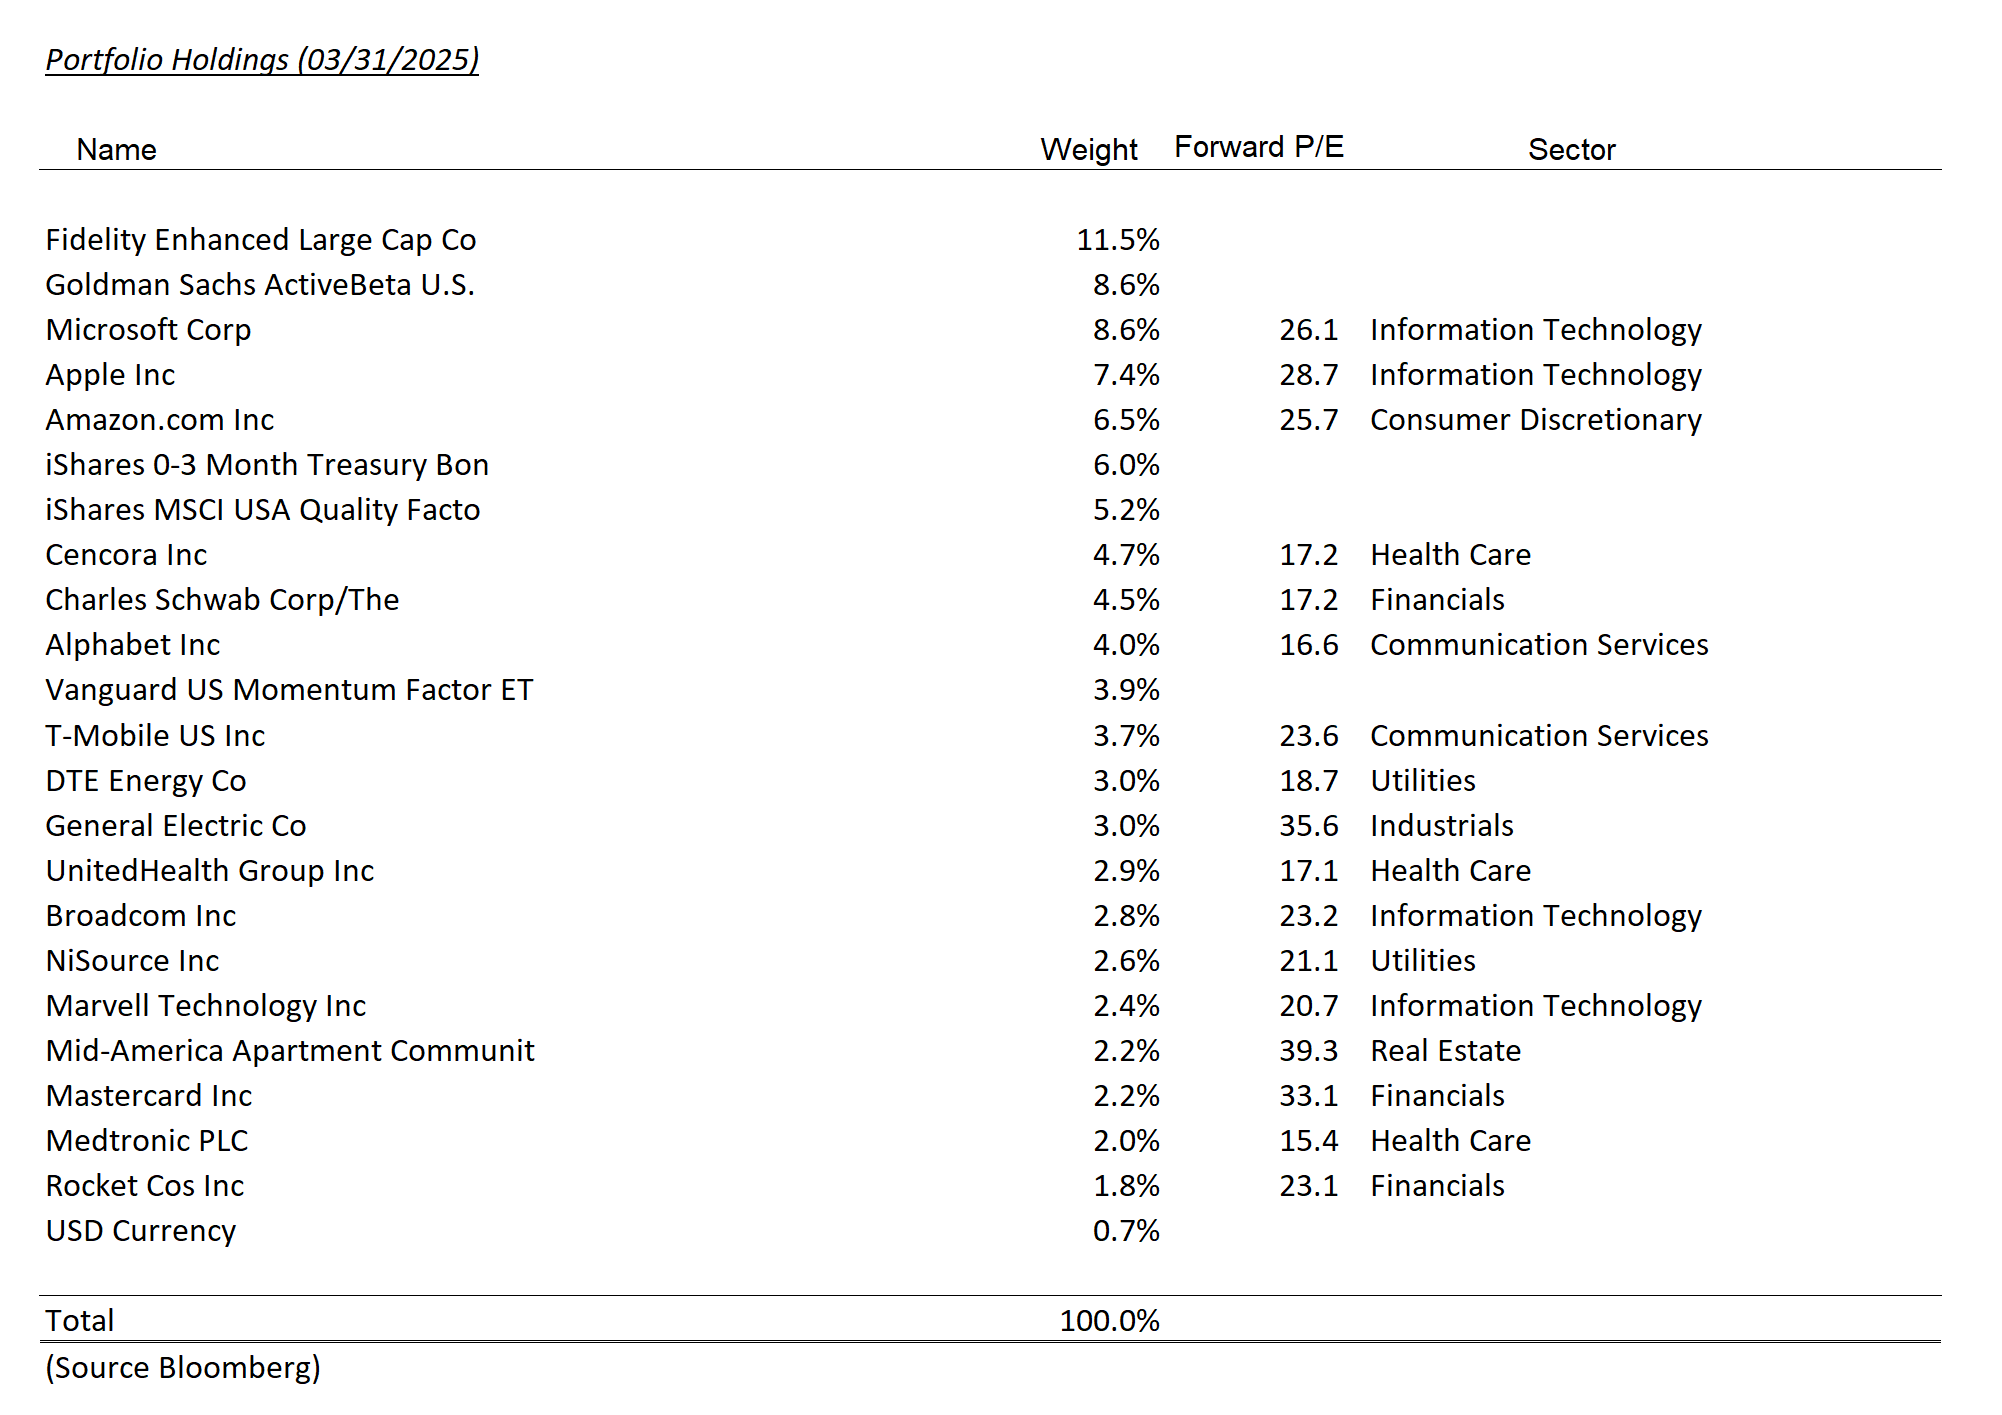
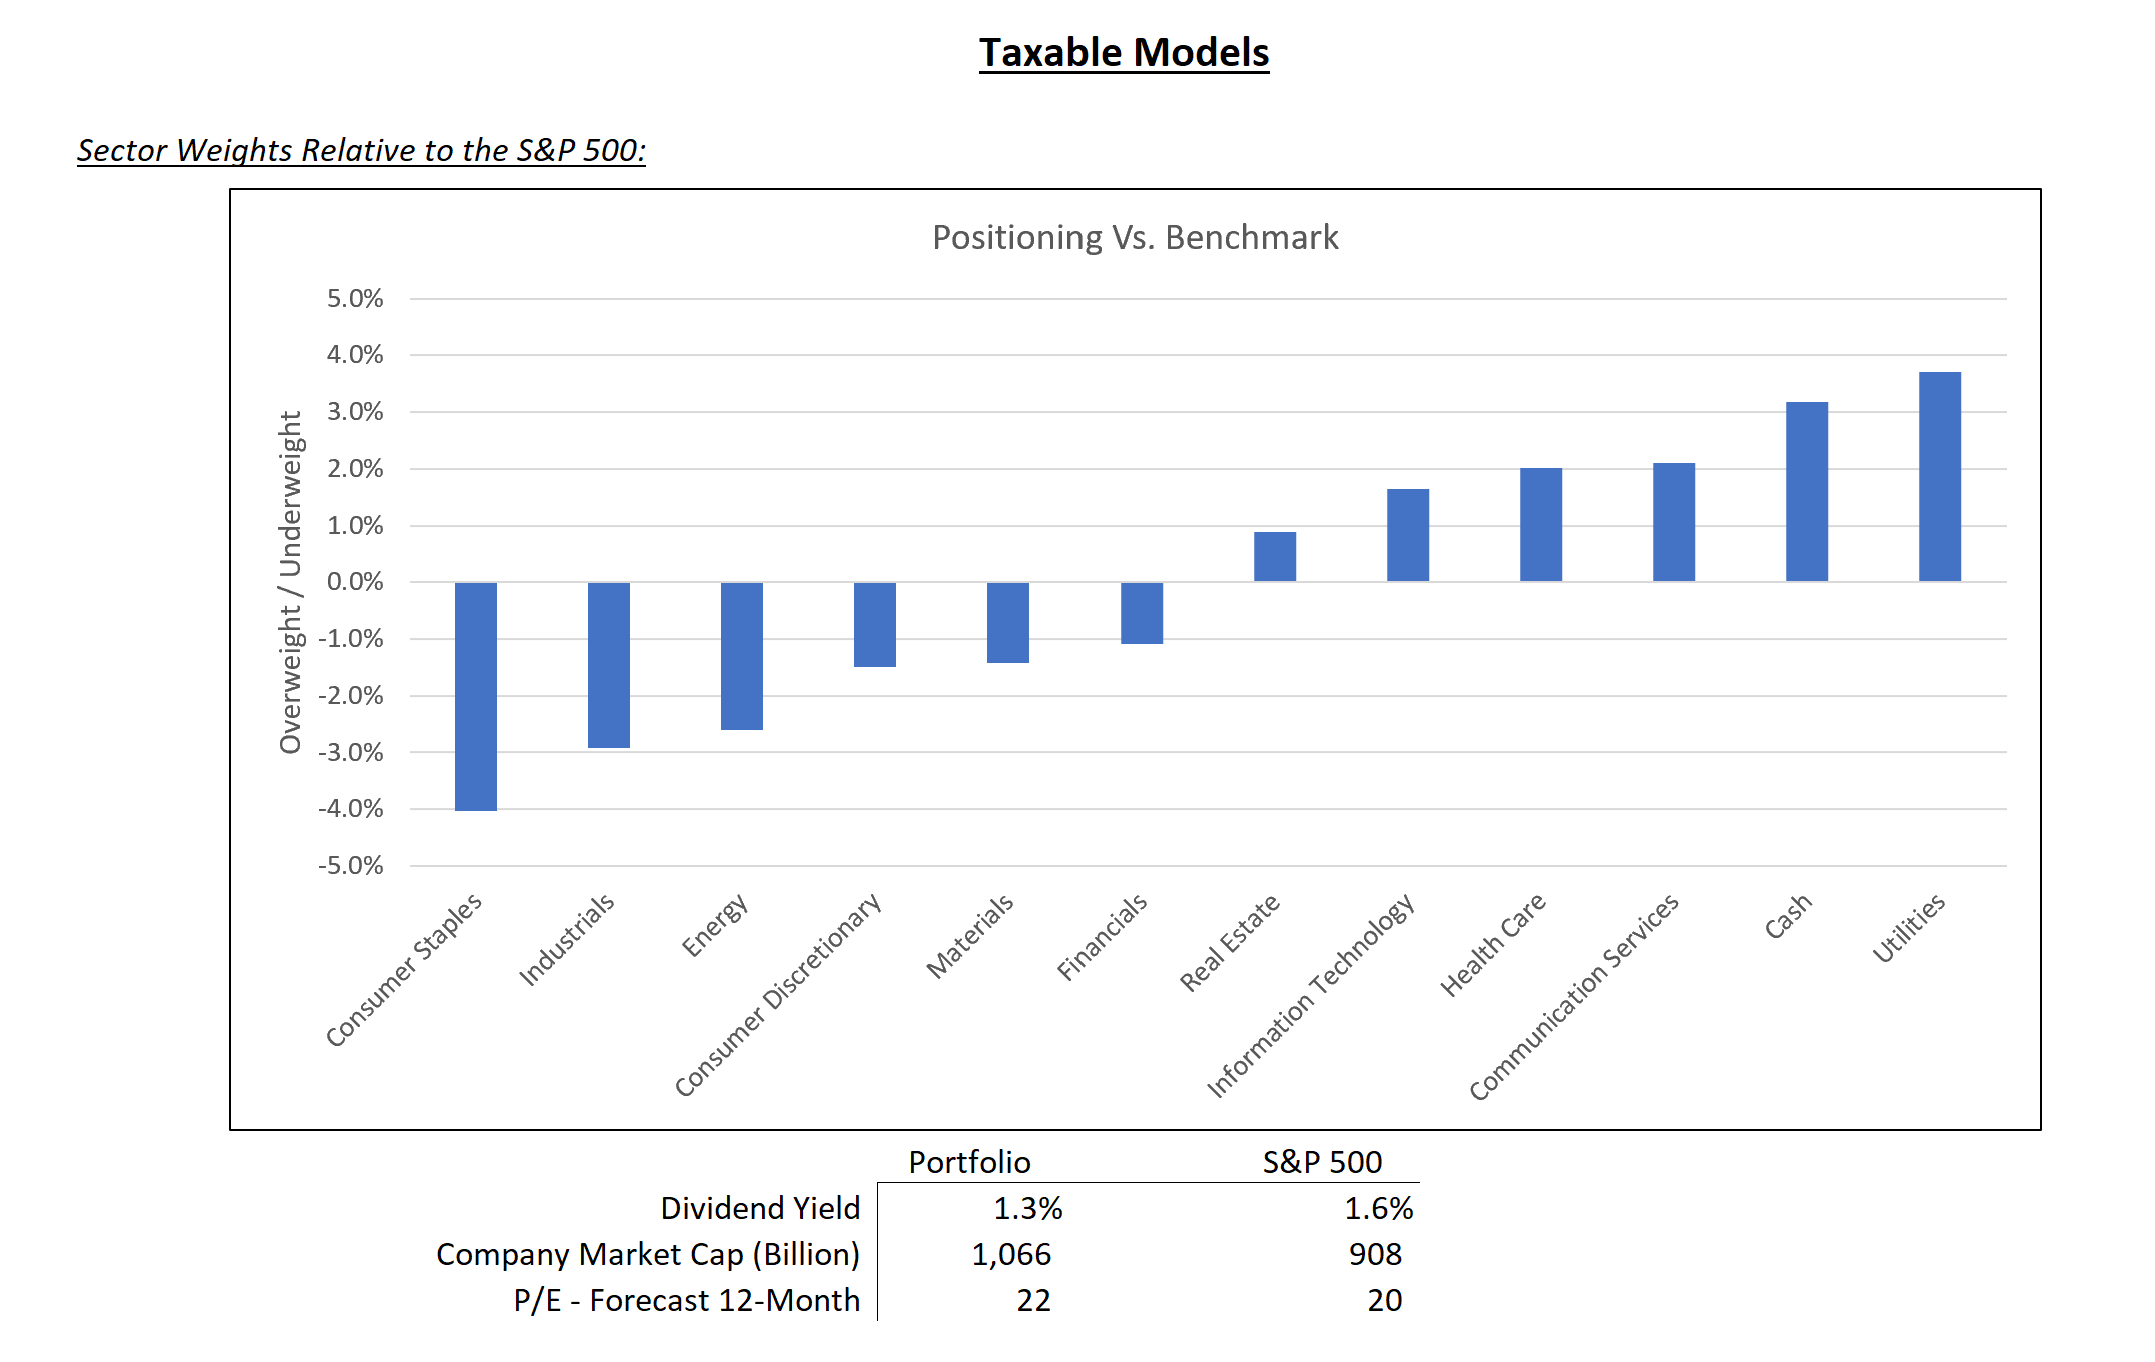
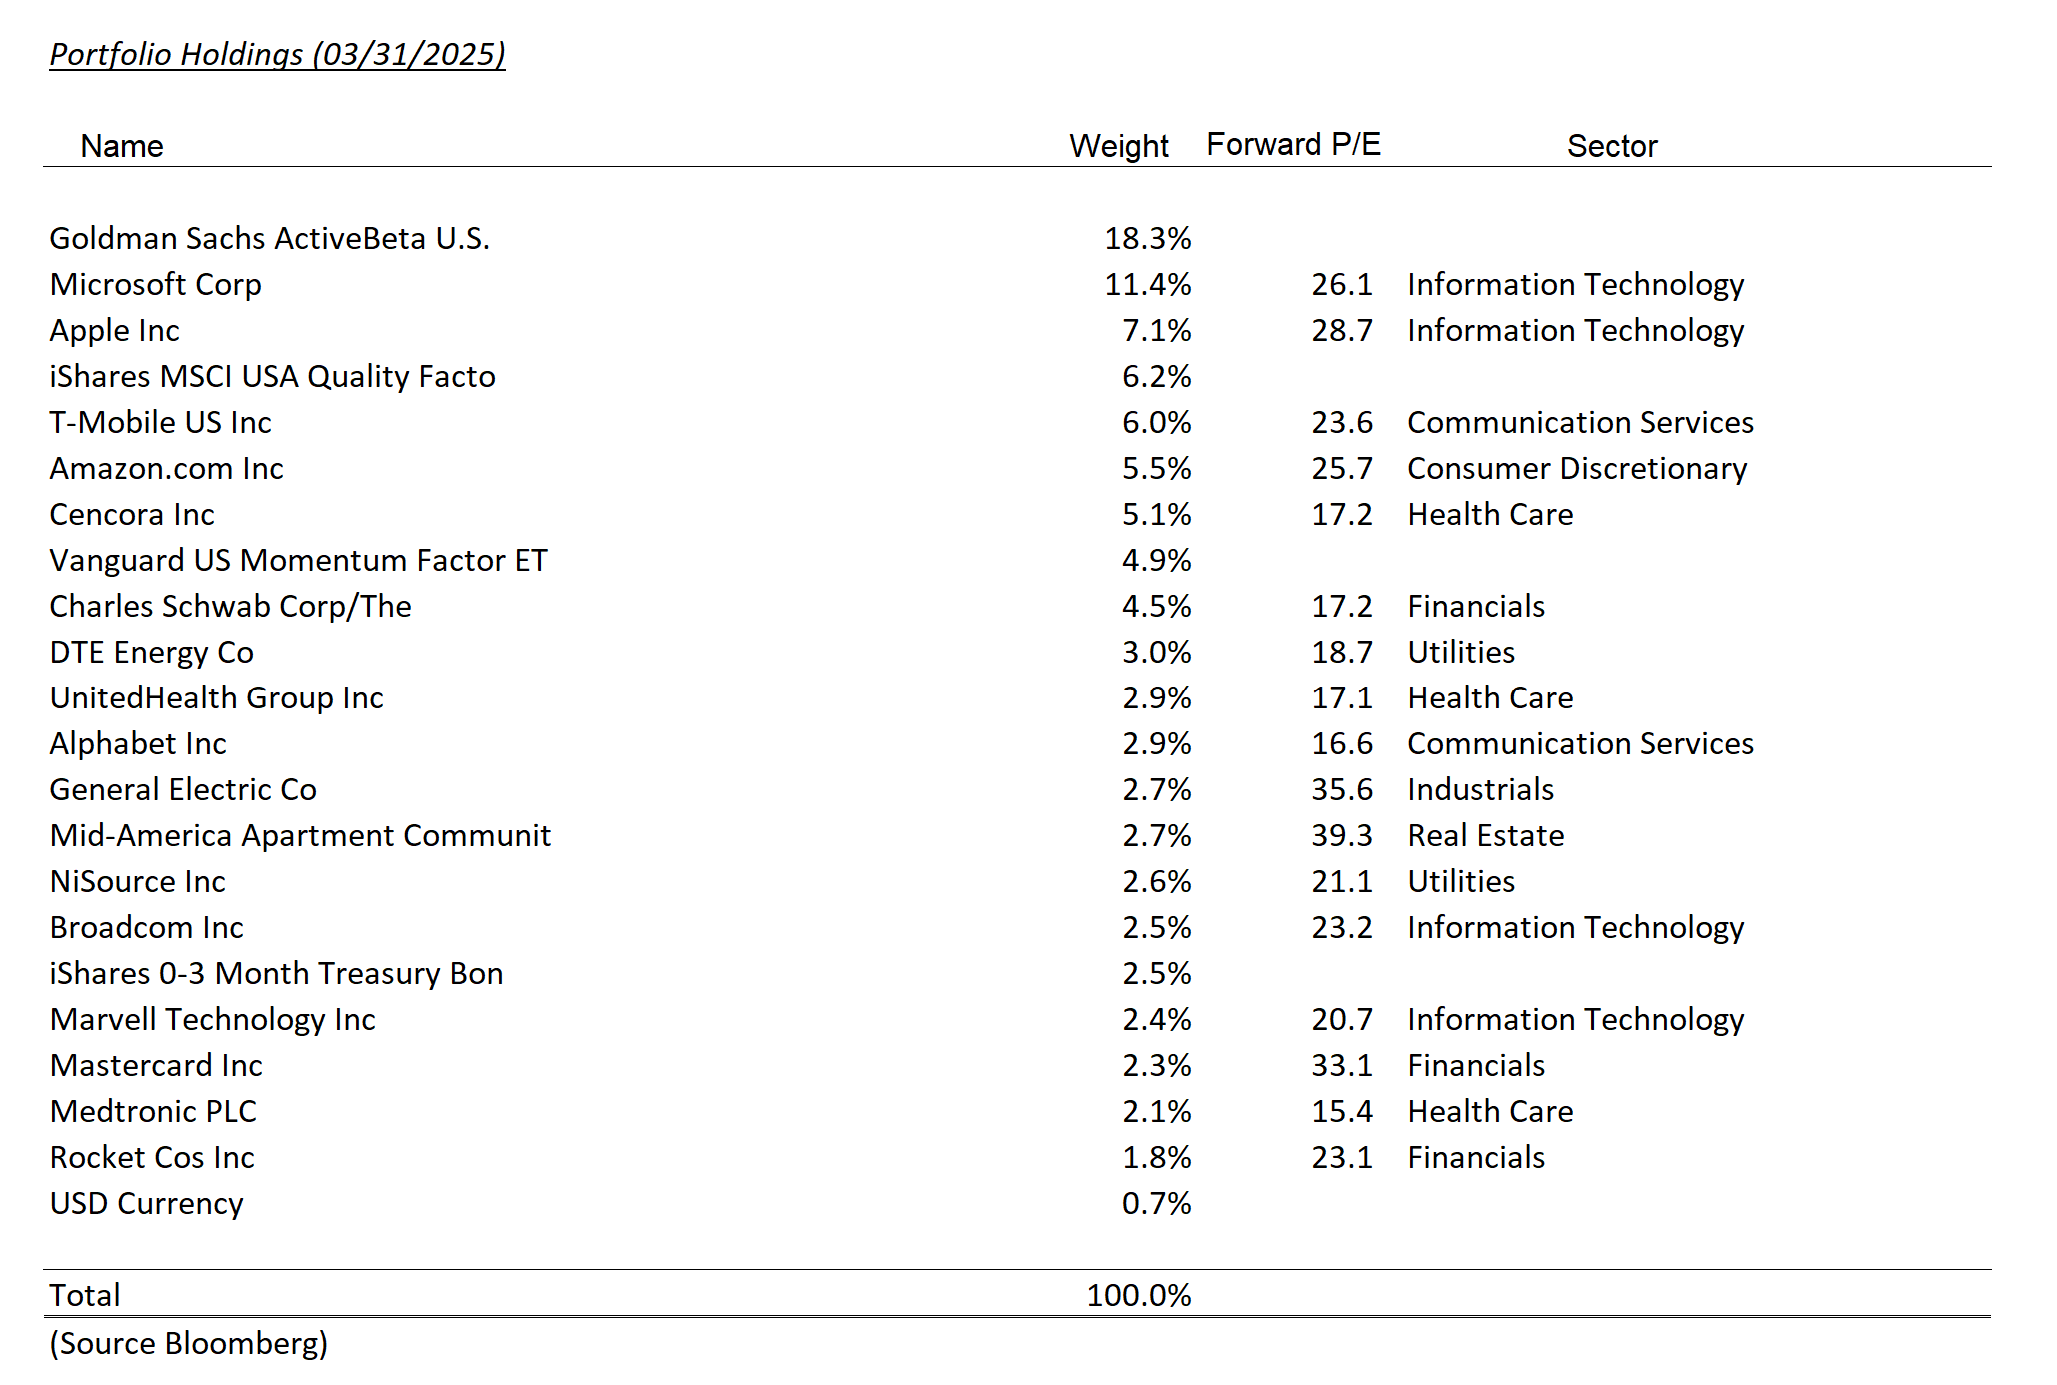
March Changes
Tax Deferred
(for mobile swipe left to right)
| New Additions | Complete Sales | Partial Sales | Additional Buys | % of Account Traded |
|---|---|---|---|---|
| MDT | 2.0% | |||
| SDHC | 1.0% | |||
| UNH | 1.7% | |||
| AVGO | 0.9% |
Taxable
(for mobile swipe left to right)
| New Additions | Complete Sales | Partial Sales | Additional Buys | % of Account Traded |
|---|---|---|---|---|
| MDT | 2.1% | |||
| QCOM | 2.2% | |||
| SDHC | 0.9% | |||
| UNH | 1.7% | |||
| AVGO | 0.7% |
Summary of Market Activity
U.S. equities struggled in March, with the S&P 500 falling 5.6% for the month. Only energy and utilities sectors posted gains, while consumer discretionary, information technology, and communication services were the primary laggards.
Portfolio Highlights: Key Contributors and Detractors
Top contributors to Lincoln Capital’s relative performance included Cencora (+9.7%), UnitedHealth Group (+10.8%), and the absence of Nvidia (-13.2%) in client portfolios. On the flip side, Marvell Technology (-32.9%) and Amazon (-10.4%) detracted most from performance. As noted last month, Marvell’s decline came amid business-specific developments that we have previously addressed.
Rocket Companies: A Transformational Month
One company worth highlighting this month is Rocket Companies (RKT), which announced two major acquisitions within 30 days—one of which could be transformational for the business. The first was the $1.75 billion purchase of Redfin (RDFN) on March 10. While relatively modest compared to Rocket’s >$30 billion market cap at the time, the logic is clear: Rocket has historically been skewed toward refinancing, and Redfin strengthens its purchase mortgage pipeline.
Rocket already operates Rocket Homes, a home search portal that offers significant closing credits when buyers use a Rocket Homes agent and Rocket Mortgage—some credits are worth several thousands of dollars, even approaching $10,000. Rocket’s presentation suggests that for an average home sale ($430,000), total transaction costs—title premiums, agent fees, and mortgage profits—amount to $40,000. The company aims to cut this figure in half, passing savings on to clients.
The second—and more impactful—deal came on March 31, with the $9.4 billion acquisition of Mr. Cooper, the nation’s largest mortgage servicer. This deal adds $736 billion in servicing volume to Rocket’s existing $526 billion, which when combined with sub-servicing arrangements, will result in a combined servicing portfolio of over $2.2 trillion—now making Rocket the servicer of 1 in every 6 U.S. mortgages.
The strategic rationale here centers on Rocket’s industry-leading recapture rate of 83%, meaning it retains most clients when loans are paid off / refinanced. Mr. Cooper’s rate, while lower (50%+), is still strong, and Rocket sees this as a cost-effective way to expand its customer base. Given that 21% of the combined servicing portfolio (about $266 billion) has mortgage rates above 6%, these loans are ripe for refinancing—providing an opportunity for high-margin revenue.
A Long-Term Vision for Customer Lifecycle
Beyond near-term synergies, Rocket’s strategy appears focused on building longer, more integrated client relationships—from home search and purchase to financing, servicing, refinancing, and beyond. One notable comment from CEO Varun Krishna captured our attention:
Looking ahead, we envision mortgage brokers having access to servicing capabilities for their own clients in a future where their name appears in the mortgage statement, keeping the client relationship where it belongs with the broker. – Varun Krishna, RKT CEO
If Rocket offers white-labeled servicing capabilities to third-party brokers—and shares in servicing revenue—it could significantly improve recapture rates and attract more wholesale business.
Capturing a Bigger Share of a Massive Market
Rocket still has room to grow. In 2024, the U.S. real estate market likely generated, per Lincoln Capital estimates:
- $50 billion in gain-on-sale margins
- $100 billion in real estate commissions
- $35 billion in servicing fees
By contrast, Rocket’s pro-forma trailing twelve-month revenue is just $8.4 billion, leaving ample room for market share gains.
Both acquisitions are stock-based, and the Mr. Cooper deal will be immediately accretive. While it would likely be cheaper with debt financing, it’s unclear whether RKT could have financed the deal entirely with debt. An added benefit of using stock is the increase in public float, improving liquidity and accessibility for a wider investor base (currently just $1.8 billion is traded, due to founder Dan Gilbert’s large ownership).
Governance and Capital Returns
In connection with the Redfin acquisition, Rocket also announced a simplified corporate structure, and Dan Gilbert will relinquish his 10 to 1 voting power, an encouraging step toward improved governance. While Gilbert remains the majority owner, this change lays the groundwork for greater long-term accountability.
And lastly, along with the Redfin deal, RKT paid shareholders an $0.80 dividend on April 3, a welcome bonus to cap off an eventful and transformative month!
*All figures sourced from Bloomberg. Please note that due to rounding differences, certain data presented may not sum to 100%.


Disclosures
The views expressed represent the opinions of Lincoln Capital Corporation as of the date noted and are subject to change. These views are not intended as a forecast, a guarantee of future results, investment recommendation, or an offer to buy or sell any securities. The information provided is of a general nature and should not be construed as investment advice or to provide any investment, tax, financial or legal advice or service to any person. The information contained has been compiled from sources deemed reliable, yet accuracy is not guaranteed.
Additional information, including management fees and expenses, is provided on our Form ADV Part 2 available upon request or at the SEC’s Investment Adviser Public Disclosure website.
Past performance is not a guarantee of future results. Please note that due to rounding differences, certain data presented may not sum to 100%.
The investments presented are examples of the securities held, bought and/or sold in Lincoln Capital Corporation strategies during the last 12 months. These investments may not be representative of the current or future investments of those strategies. You should not assume that investments in the securities identified in this presentation were or will be profitable. We will furnish, upon your request, a list of all securities purchased, sold or held in the strategies during the 12 months preceding the date of this presentation. It should not be assumed that recommendations made in the future will be profitable or will equal the performance of securities identified in this presentation. Lincoln Capital Corporation or one or more of its officers or employees, may have a position in the securities presented, and may purchase or sell such securities from time to time.

