May Changes
Tax Deferred
(for mobile swipe left to right)
| New Additions | Complete Sales | Partial Sales | Additional Buys | % of Account Traded |
|---|---|---|---|---|
| BAC | 1.7% | |||
| QCOM | 0.5% | |||
| MSFT | 1.4% | |||
| AAPL | 3.3% | |||
| SDHC | 0.2% | |||
| D | 1.0% |
Taxable
(for mobile swipe left to right)
| New Additions | Complete Sales | Partial Sales | Additional Buys | % of Account Traded |
|---|---|---|---|---|
| BAC | 2.3% | |||
| AAPL | 1.5% | |||
| SDHC | 0.2% | |||
| D | 1.0% |
Summary of Month’s Action:
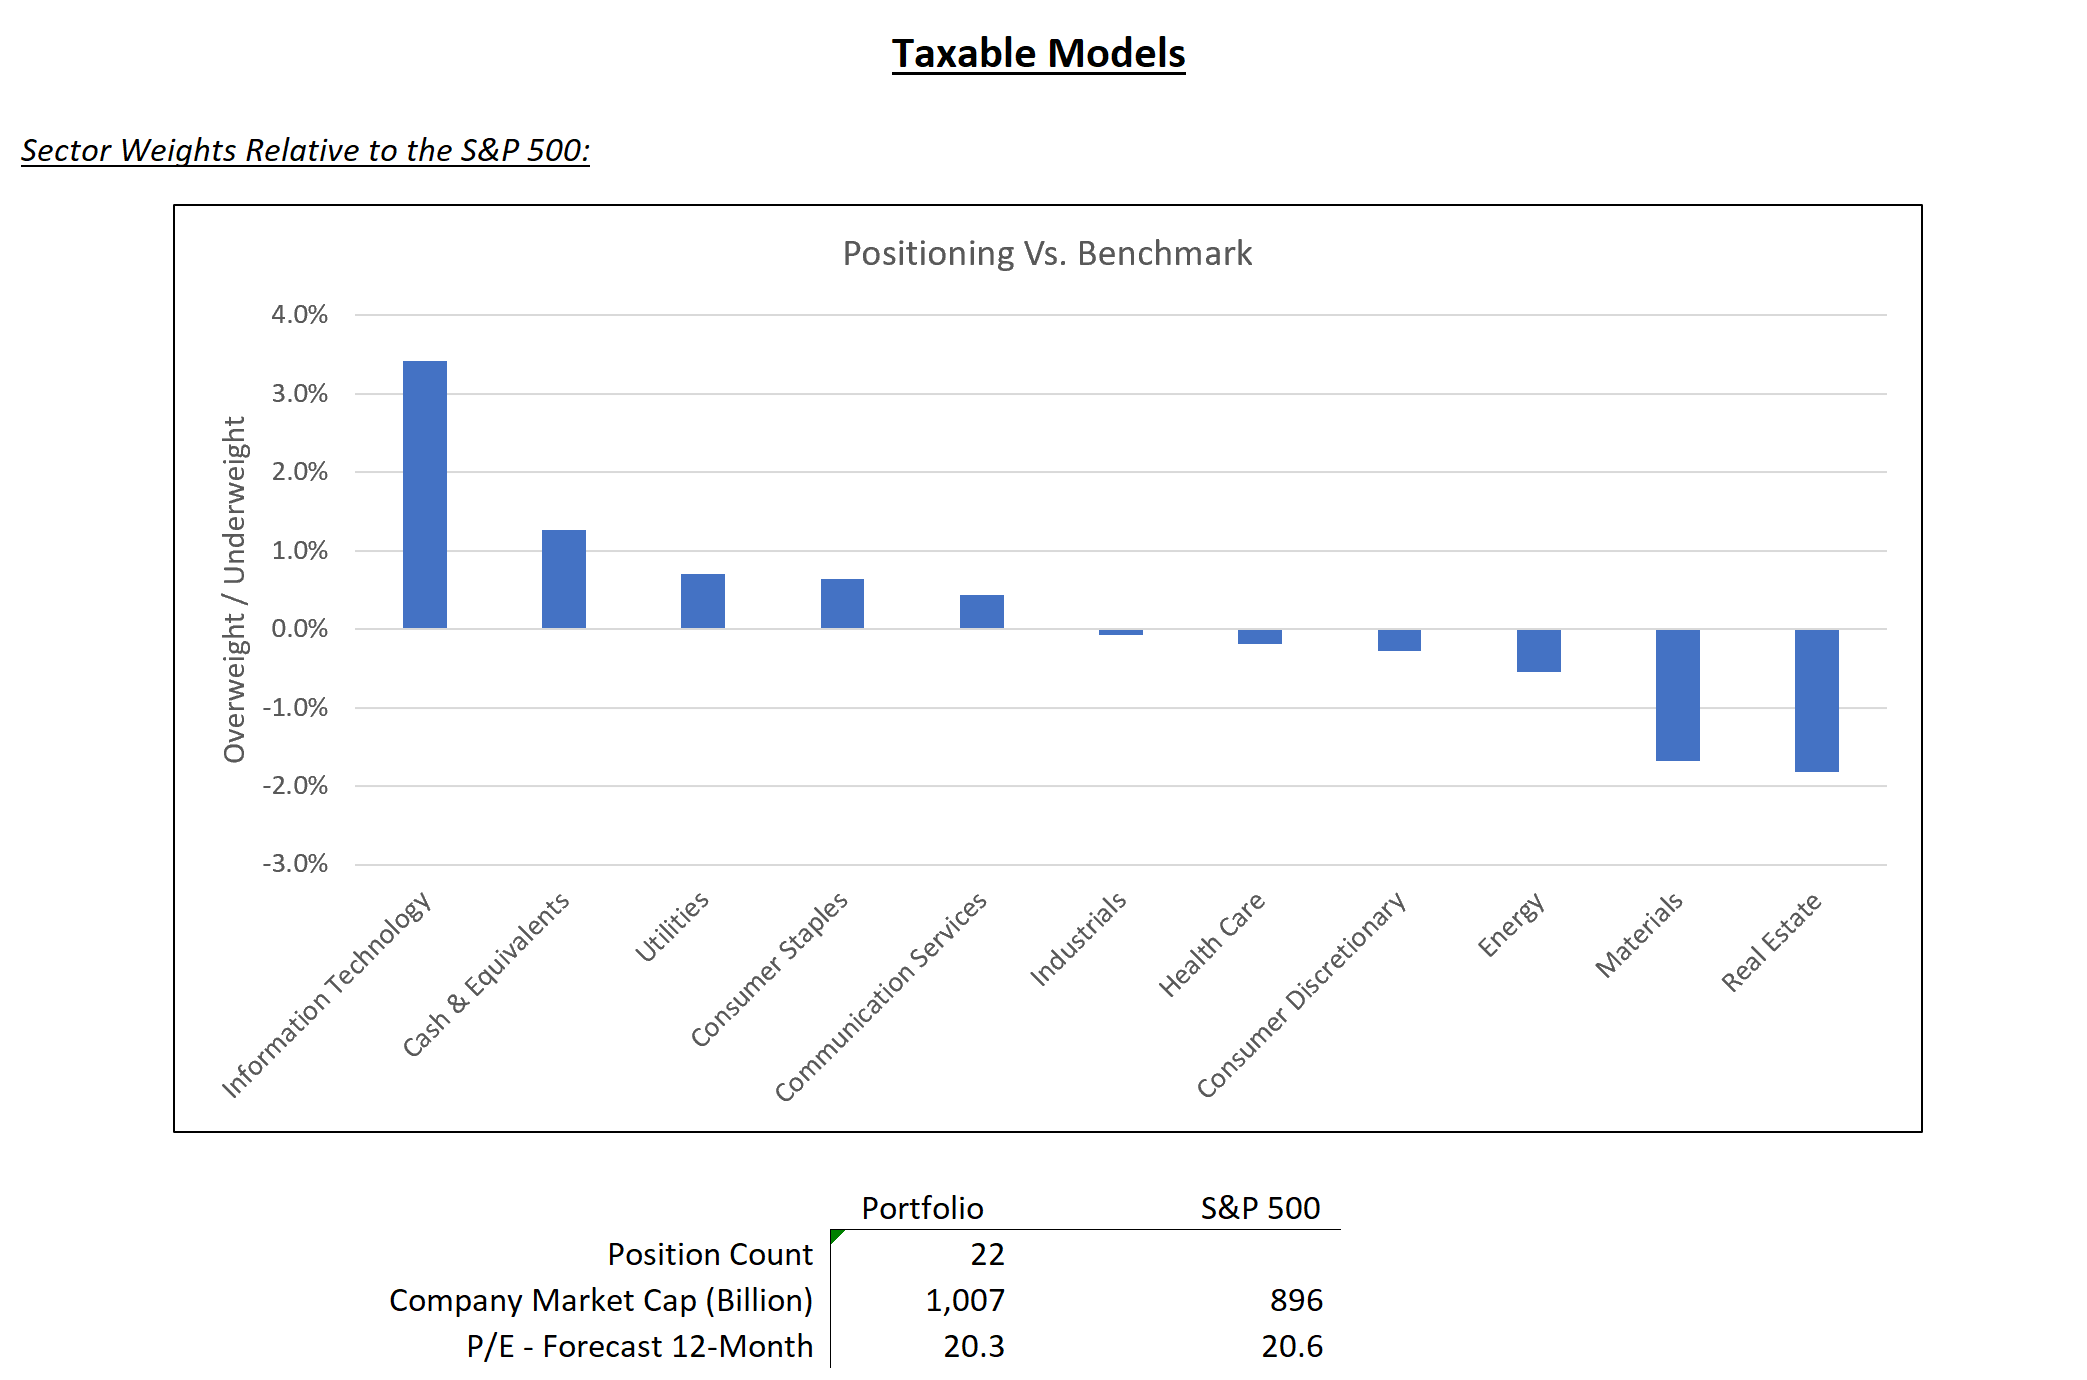
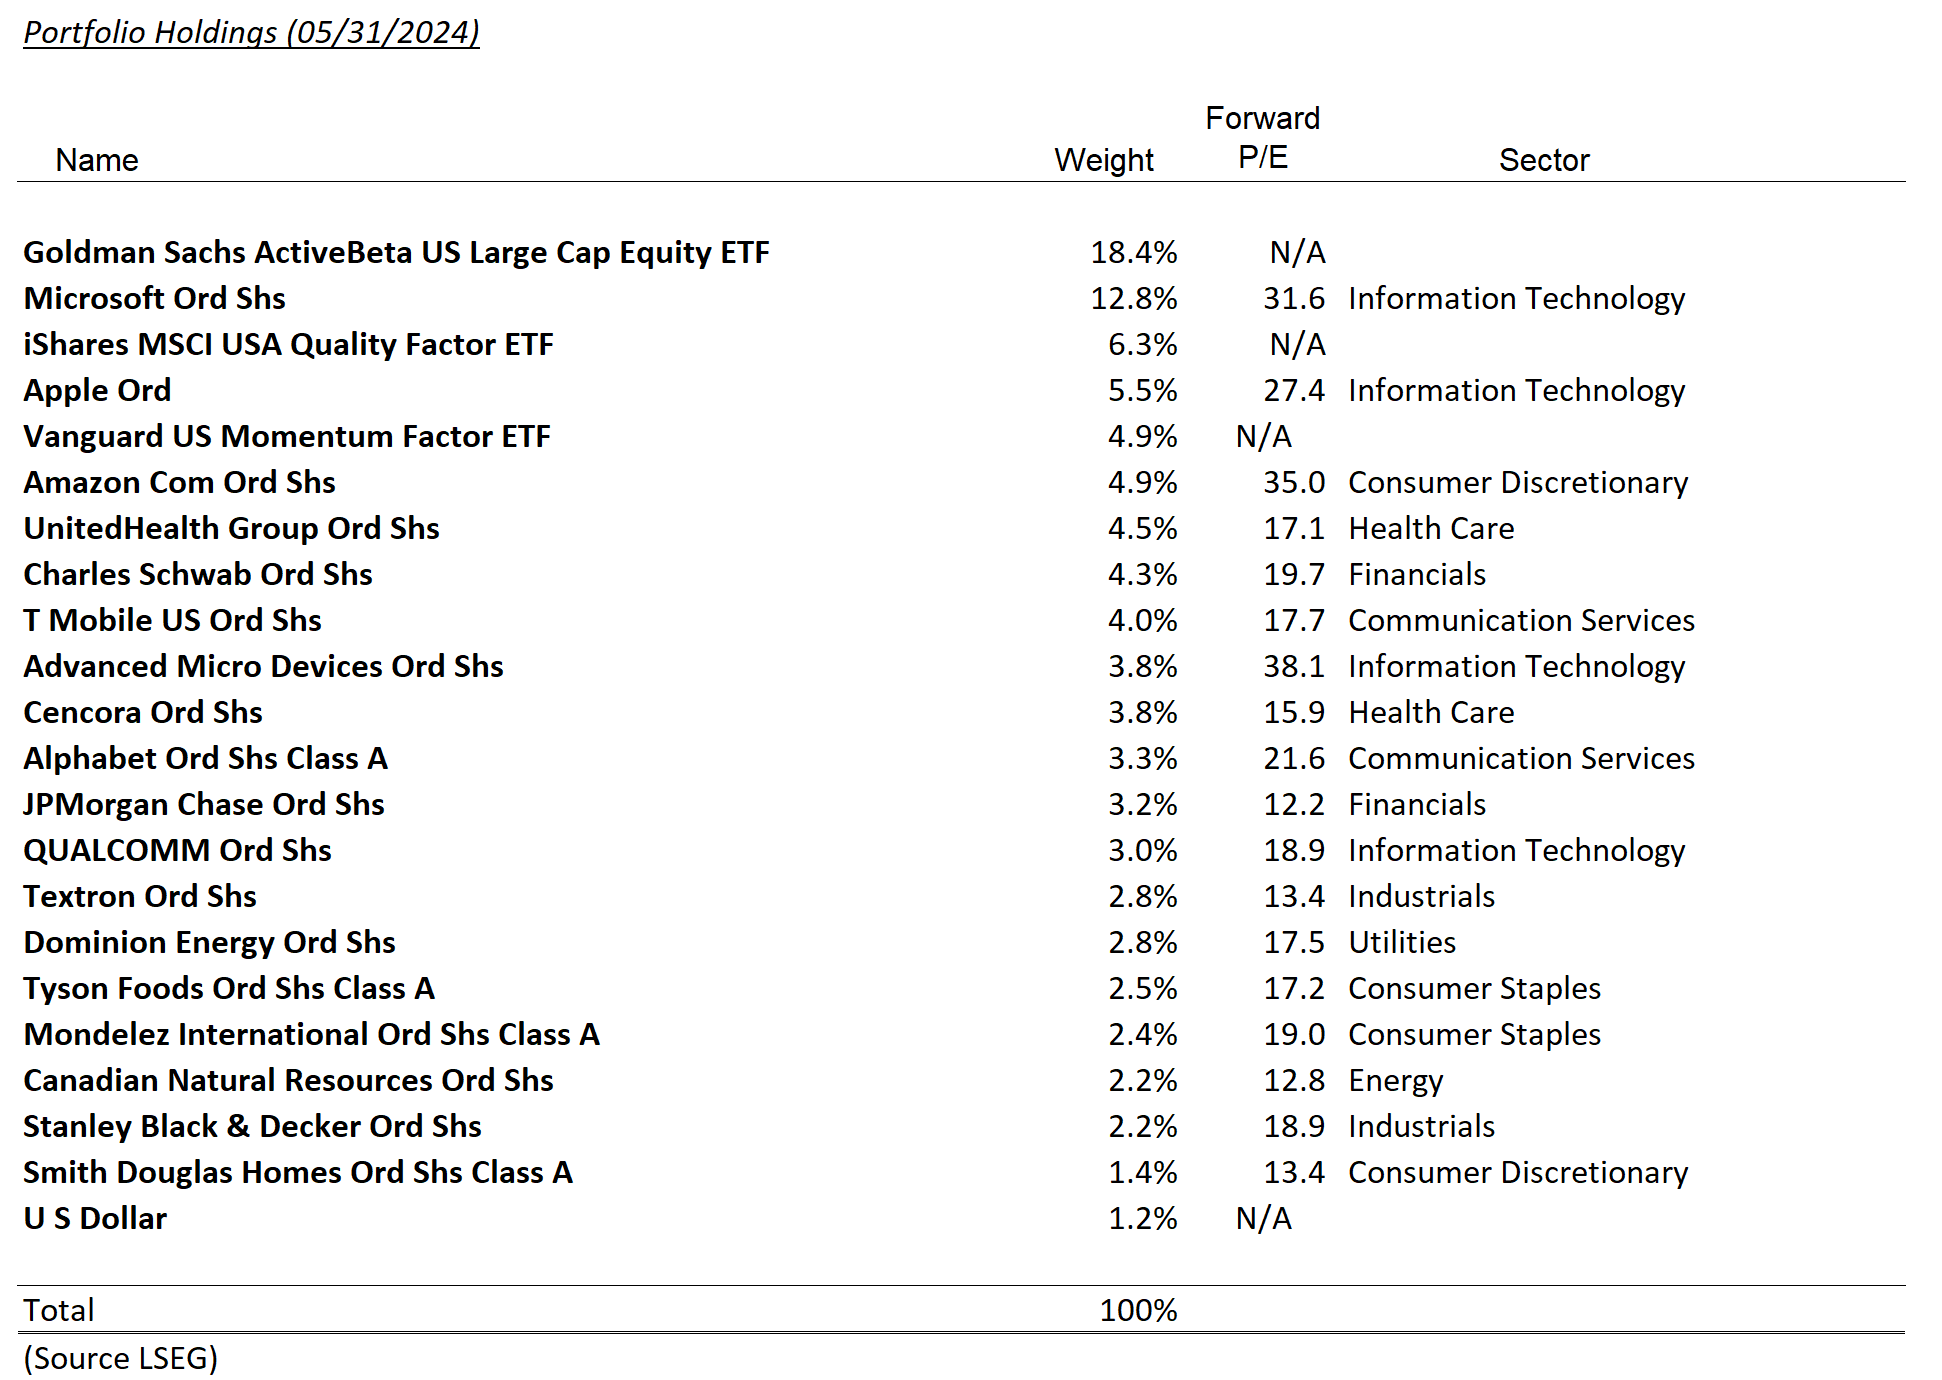
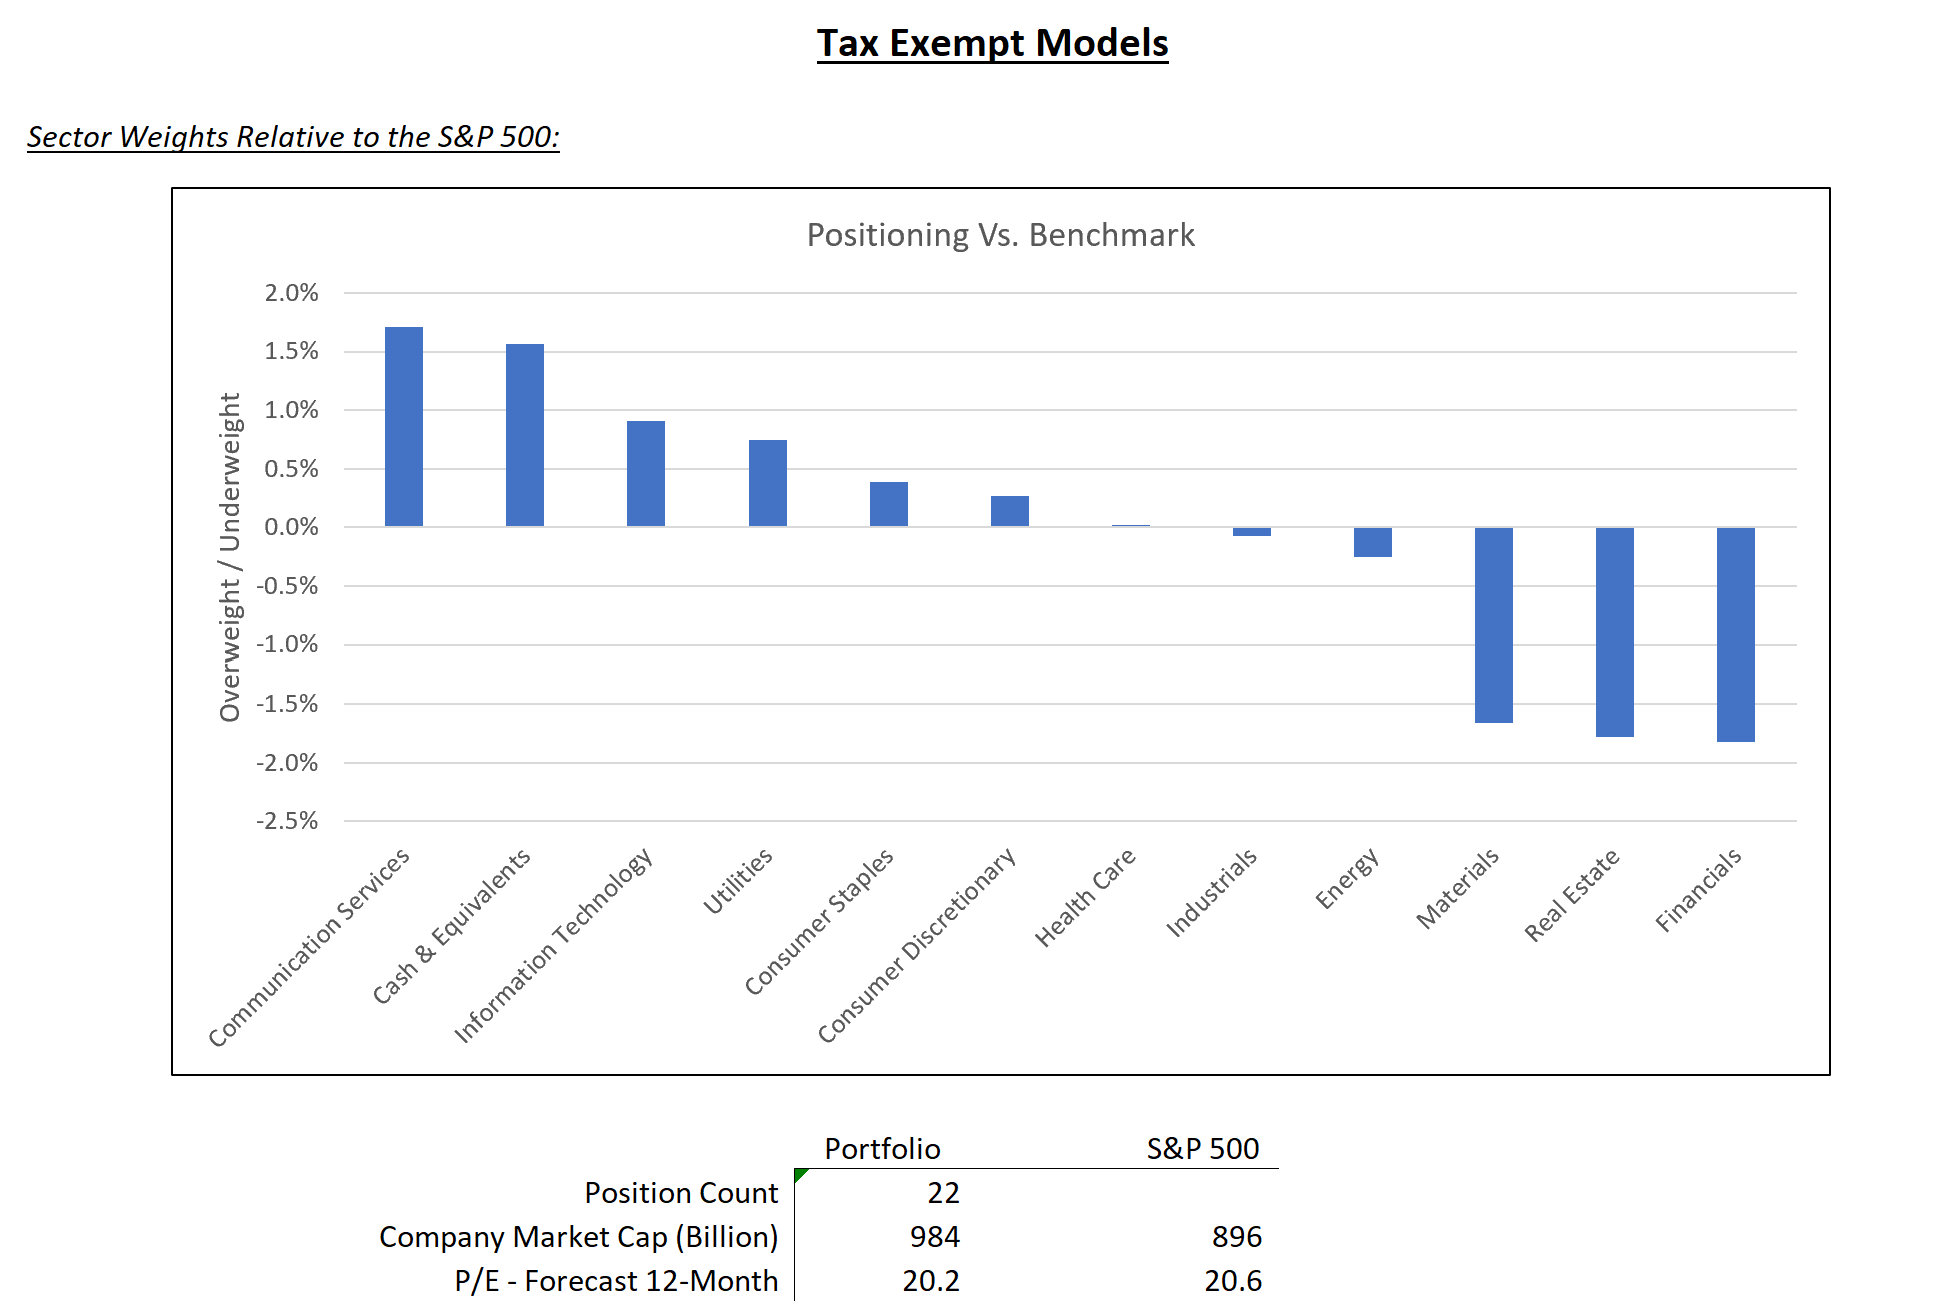
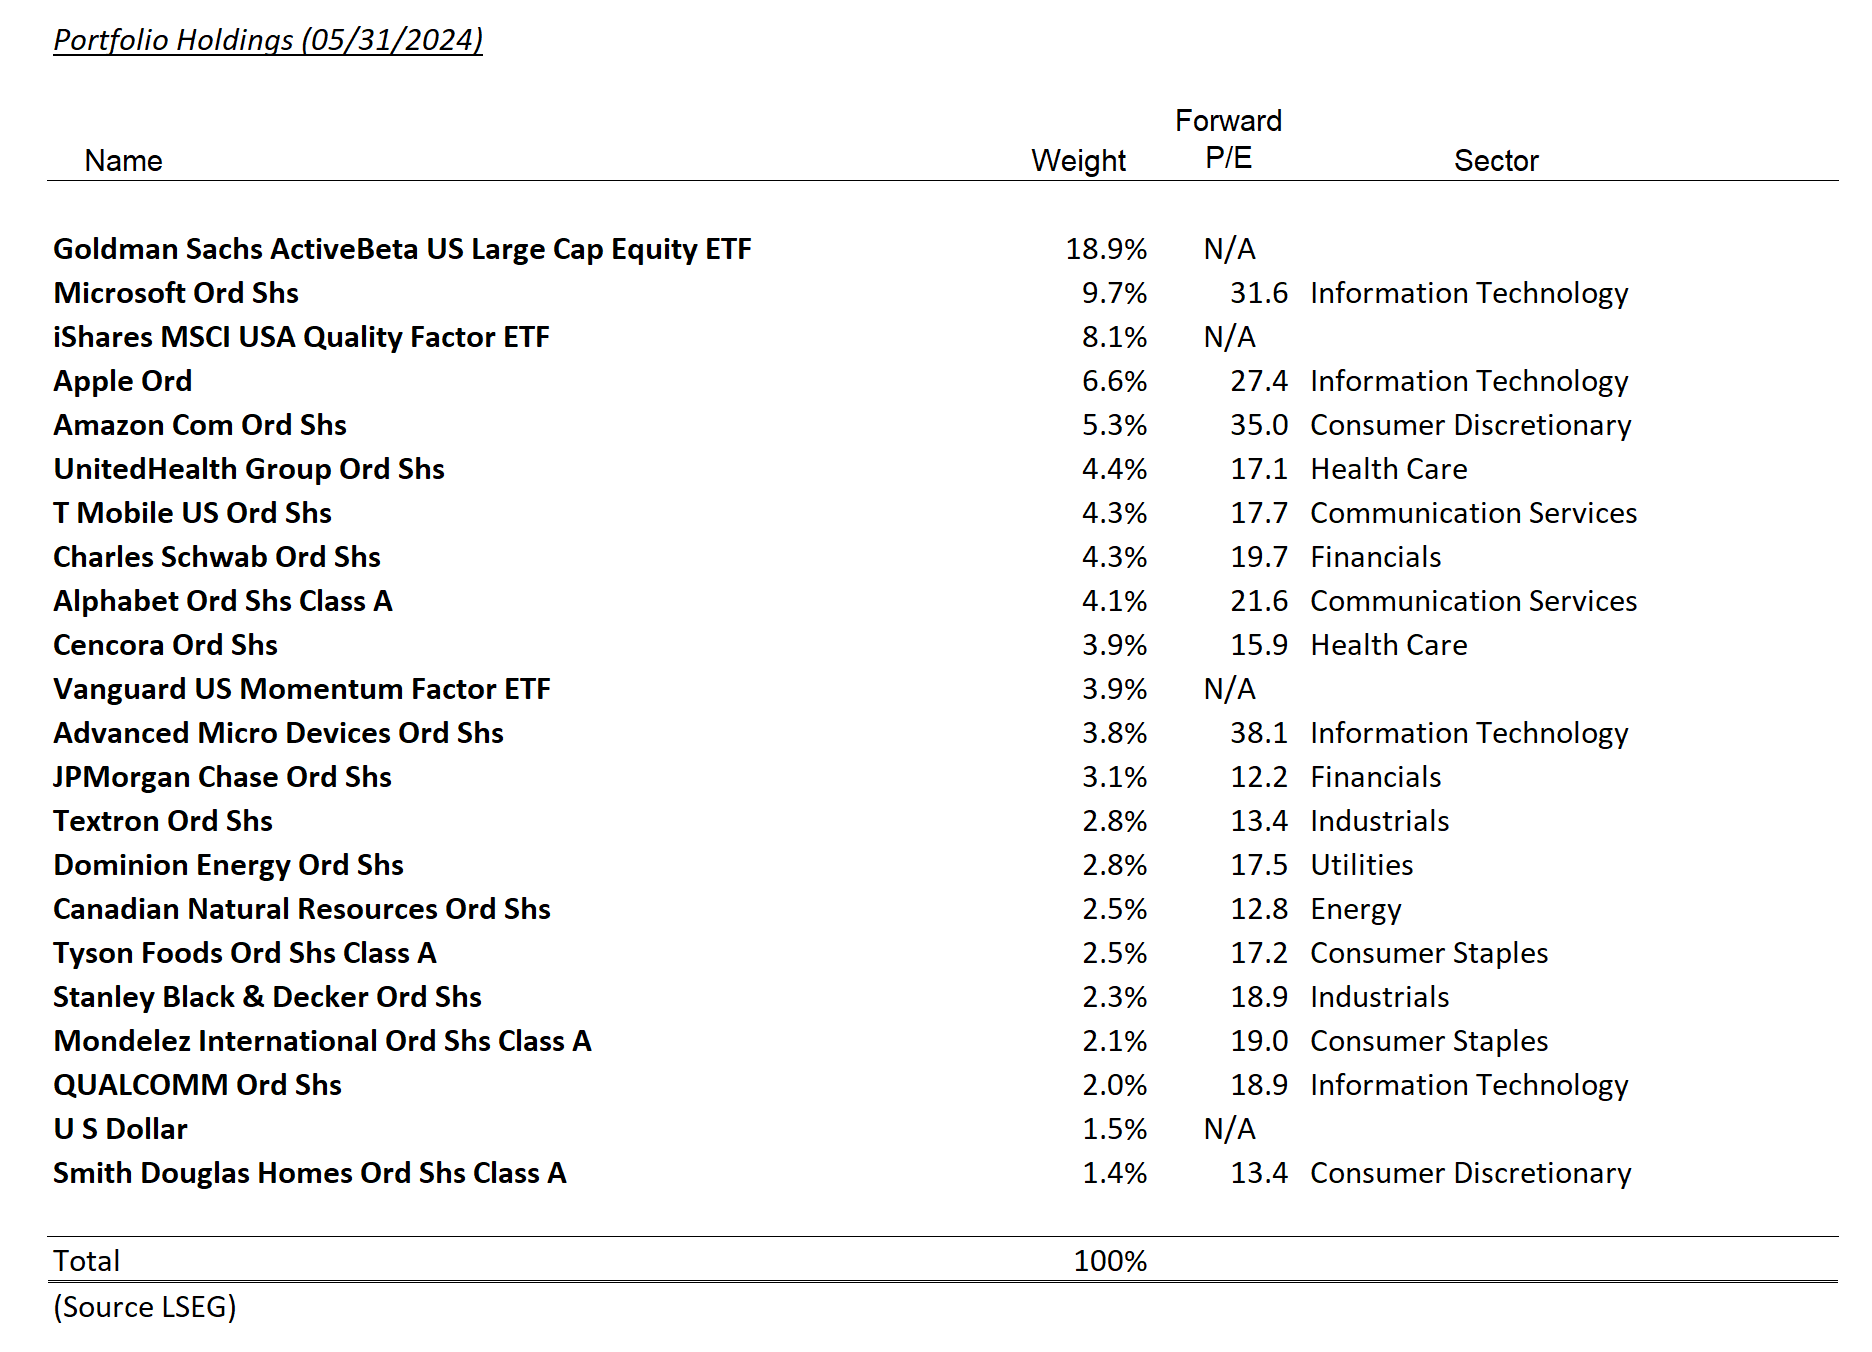
The S&P 500 gained approximately 5.0% during May, recouping the bulk of the April swoon. Information technology, utilities, and communication services led from a sector perspective, while energy, consumer discretionary and industrials lagged. In client portfolios, Qualcomm, Microsoft and T-Mobile were the top contributors, while Cencora, Tyson Foods and Stanley Black and Decker were the largest detractors. All preceding data sourced from Refinitiv.
T-Mobile’s performance is worthy of further explanation as the company benefited from merger enthusiasm. The company acquired 4 million customers, stores and some spectrum from UScellular in the quarter, at what we believe is an attractive price. T-Mobile continues to look attractive to us as the company enters its cash harvesting phase following the major acquisition and integration of Sprint.
Security Specific Comments:
Disclosures
The views expressed represent the opinions of Lincoln Capital Corporation as of the date noted and are subject to change. These views are not intended as a forecast, a guarantee of future results, investment recommendation, or an offer to buy or sell any securities. The information provided is of a general nature and should not be construed as investment advice or to provide any investment, tax, financial or legal advice or service to any person. The information contained has been compiled from sources deemed reliable, yet accuracy is not guaranteed.
Additional information, including management fees and expenses, is provided on our Form ADV Part 2 available upon request or at the SEC’s Investment Adviser Public Disclosure website.
Past performance is not a guarantee of future results. Please note that due to rounding differences, certain data presented may not sum to 100%.
The investments presented are examples of the securities held, bought and/or sold in Lincoln Capital Corporation strategies during the last 12 months. These investments may not be representative of the current or future investments of those strategies. You should not assume that investments in the securities identified in this presentation were or will be profitable. We will furnish, upon your request, a list of all securities purchased, sold or held in the strategies during the 12 months preceding the date of this presentation. It should not be assumed that recommendations made in the future will be profitable or will equal the performance of securities identified in this presentation. Lincoln Capital Corporation or one or more of its officers or employees, may have a position in the securities presented, and may purchase or sell such securities from time to time.
