August Changes
Tax Deferred
(for mobile swipe left to right)
| New Additions | Complete Sales | Partial Sales | Additional Buys | % of Account Traded |
|---|---|---|---|---|
| JPM | 3.1% | |||
| SDHC | 0.5% |
Taxable
(for mobile swipe left to right)
| New Additions | Complete Sales | Partial Sales | Additional Buys | % of Account Traded |
|---|---|---|---|---|
| JPM | 3.2% |
Summary of Month’s Action:
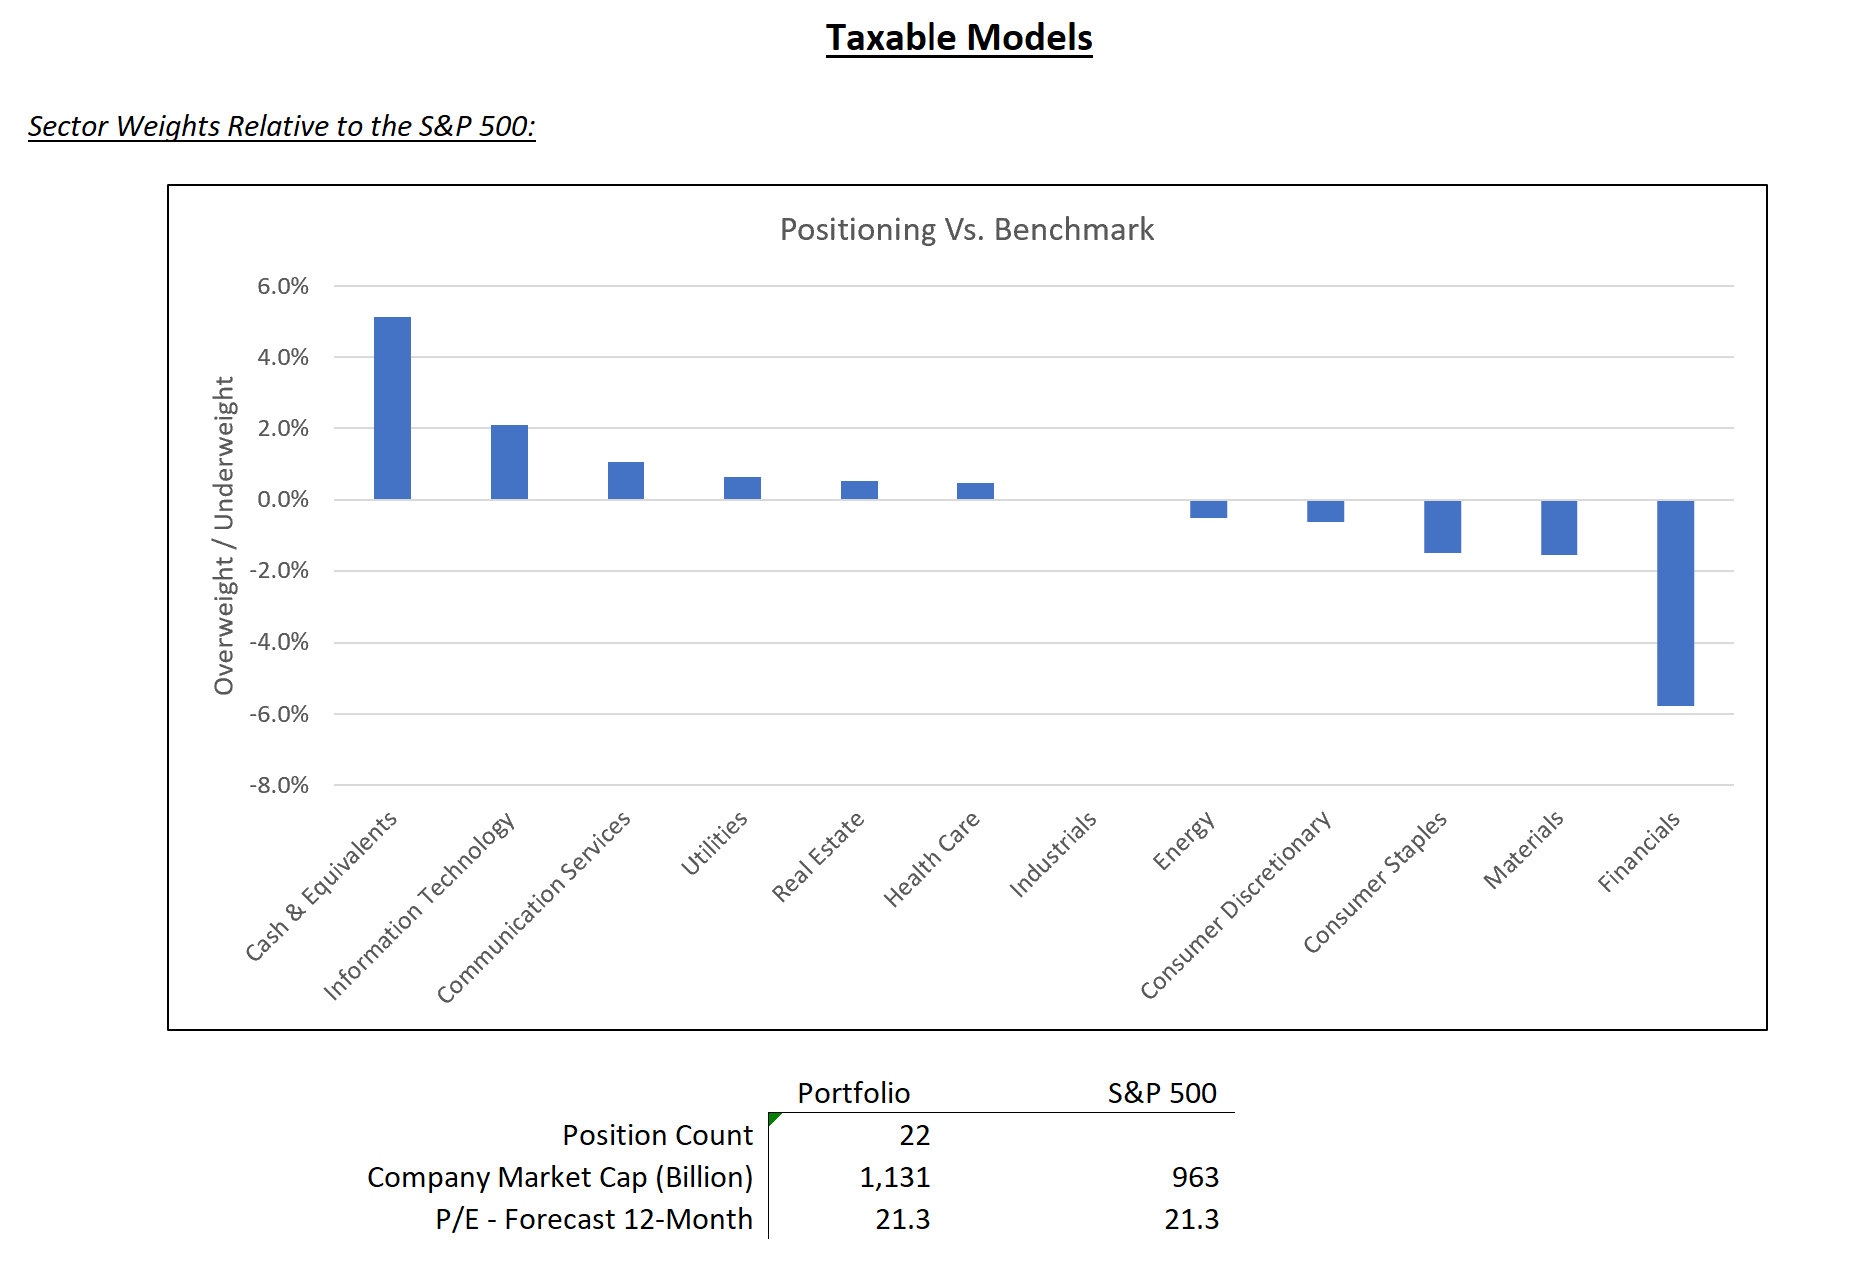
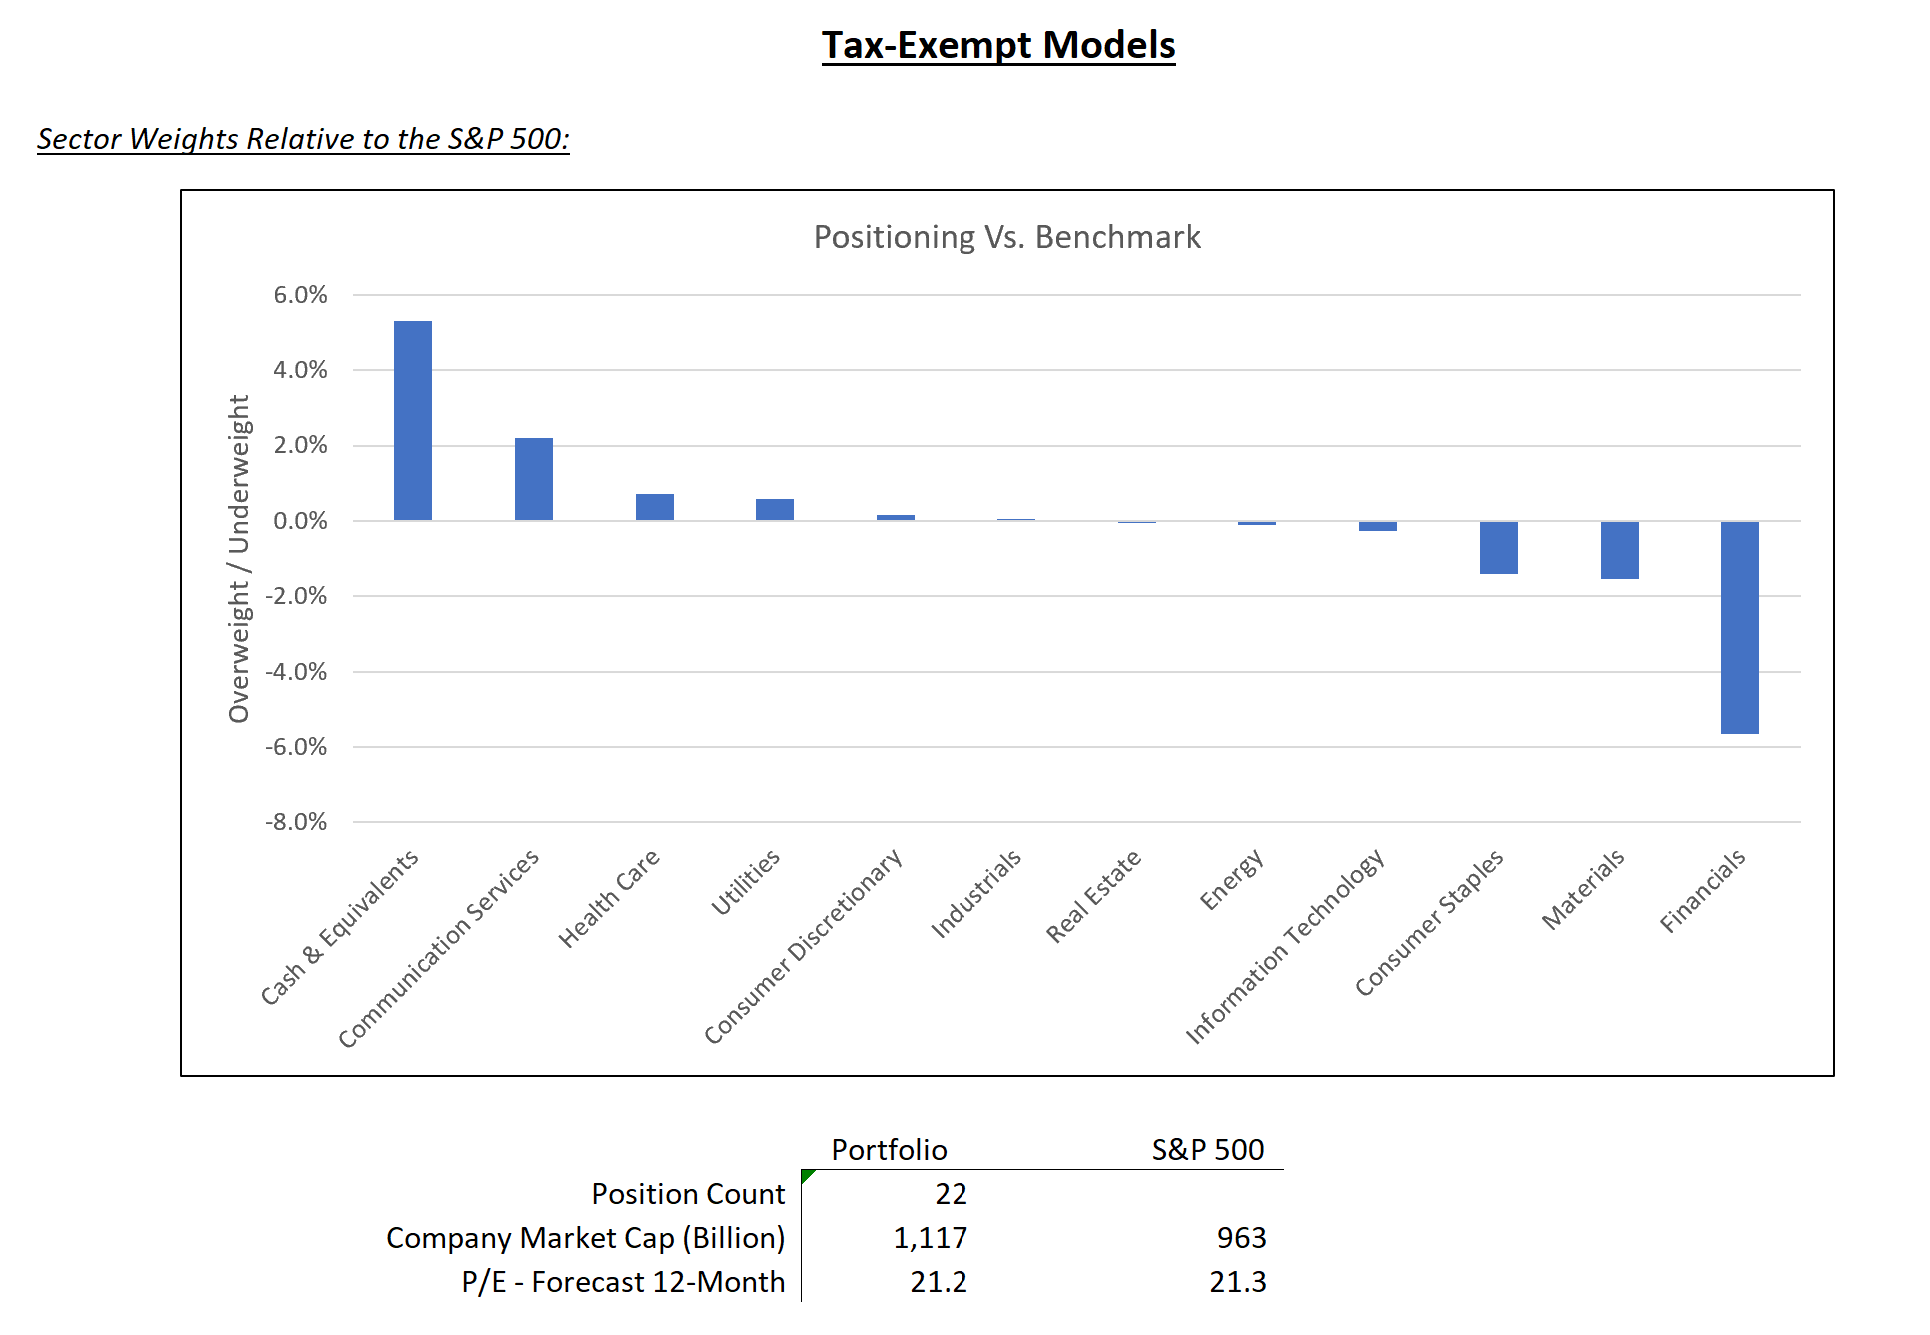
The S&P 500 delivered a 2.4% return in August, a remarkable achievement given the 6% decline it faced through August 5th. Among sectors, Consumer Staples, Real Estate, and Health Care led the way as top performers for the month, while Energy, Consumer Discretionary, and Communication Services lagged behind. All data is from Refinitiv.
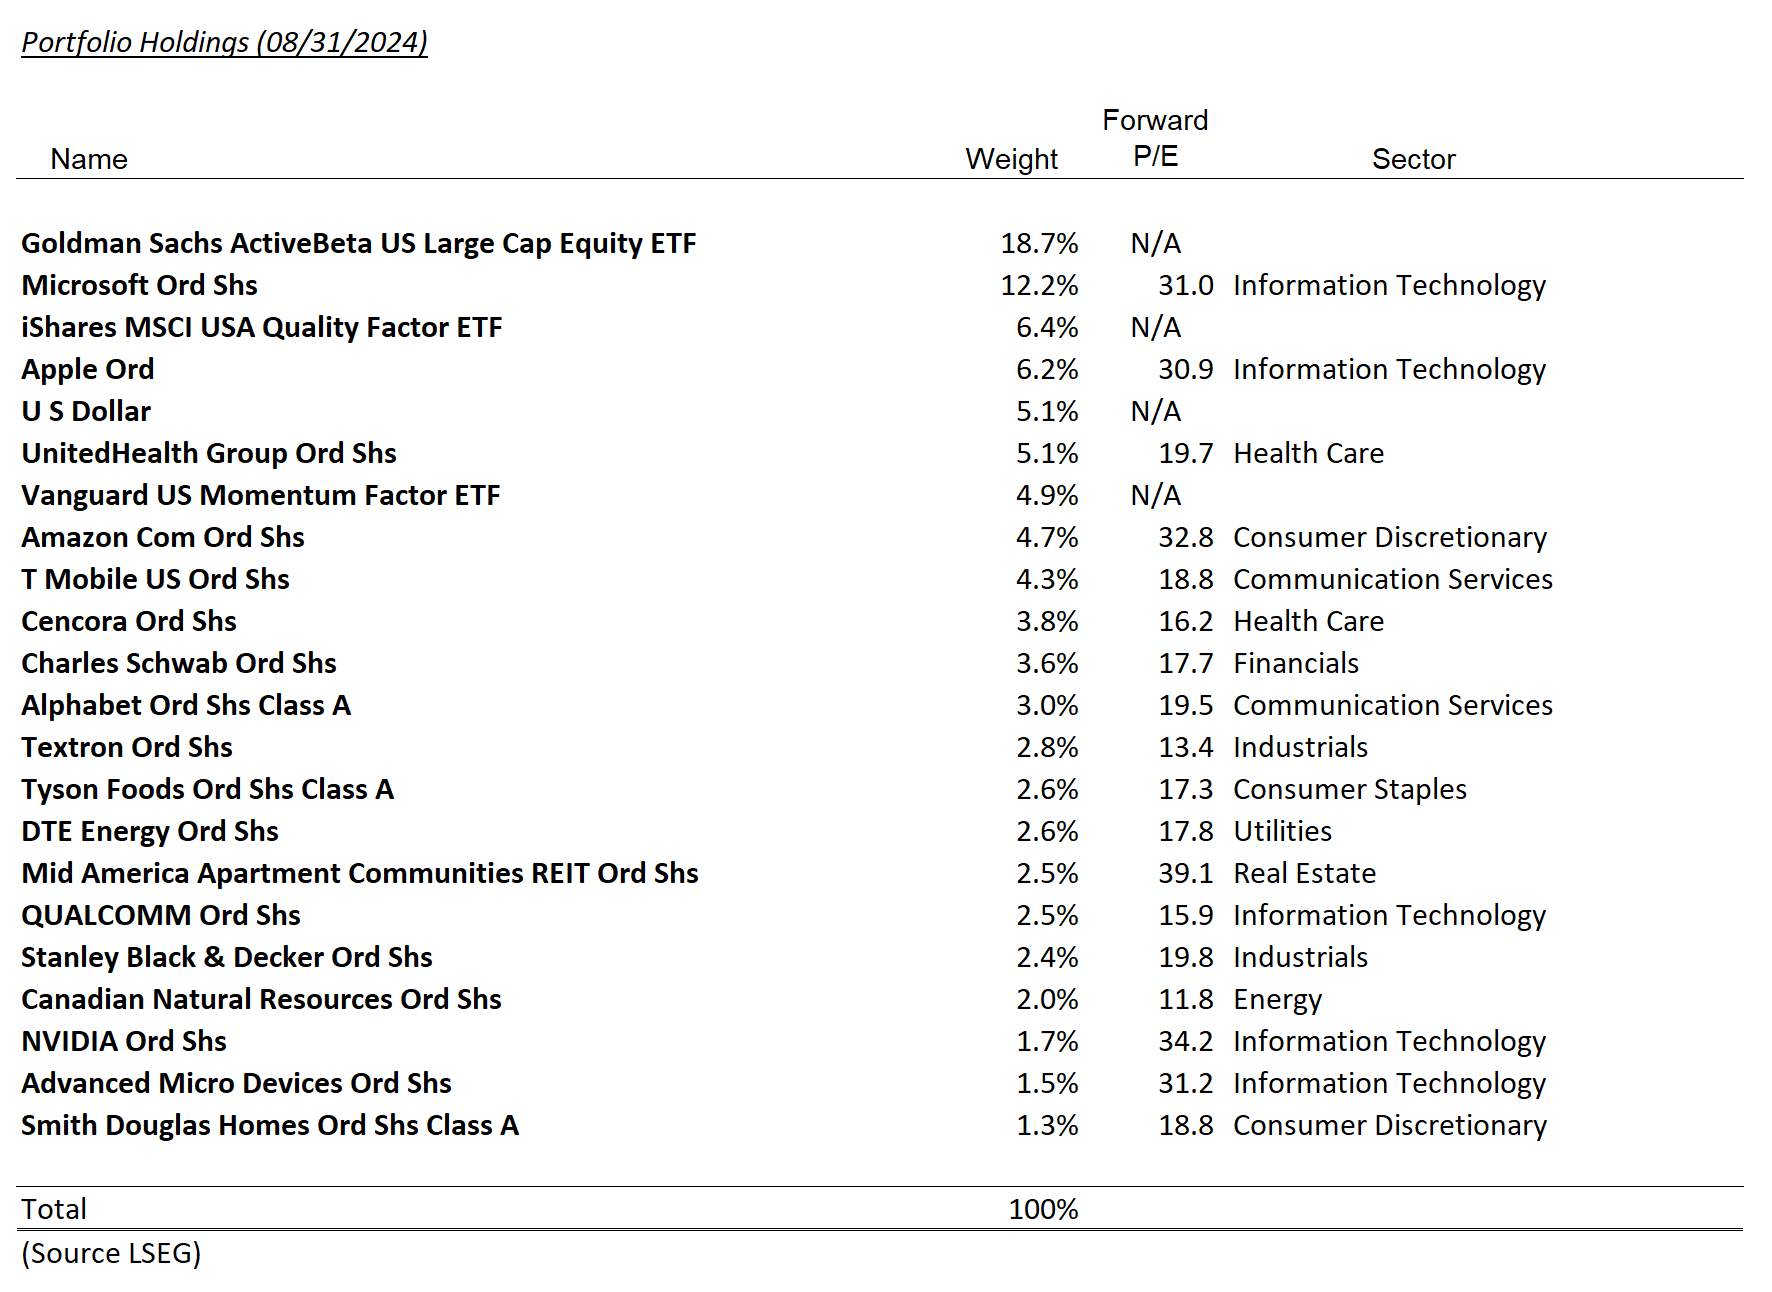
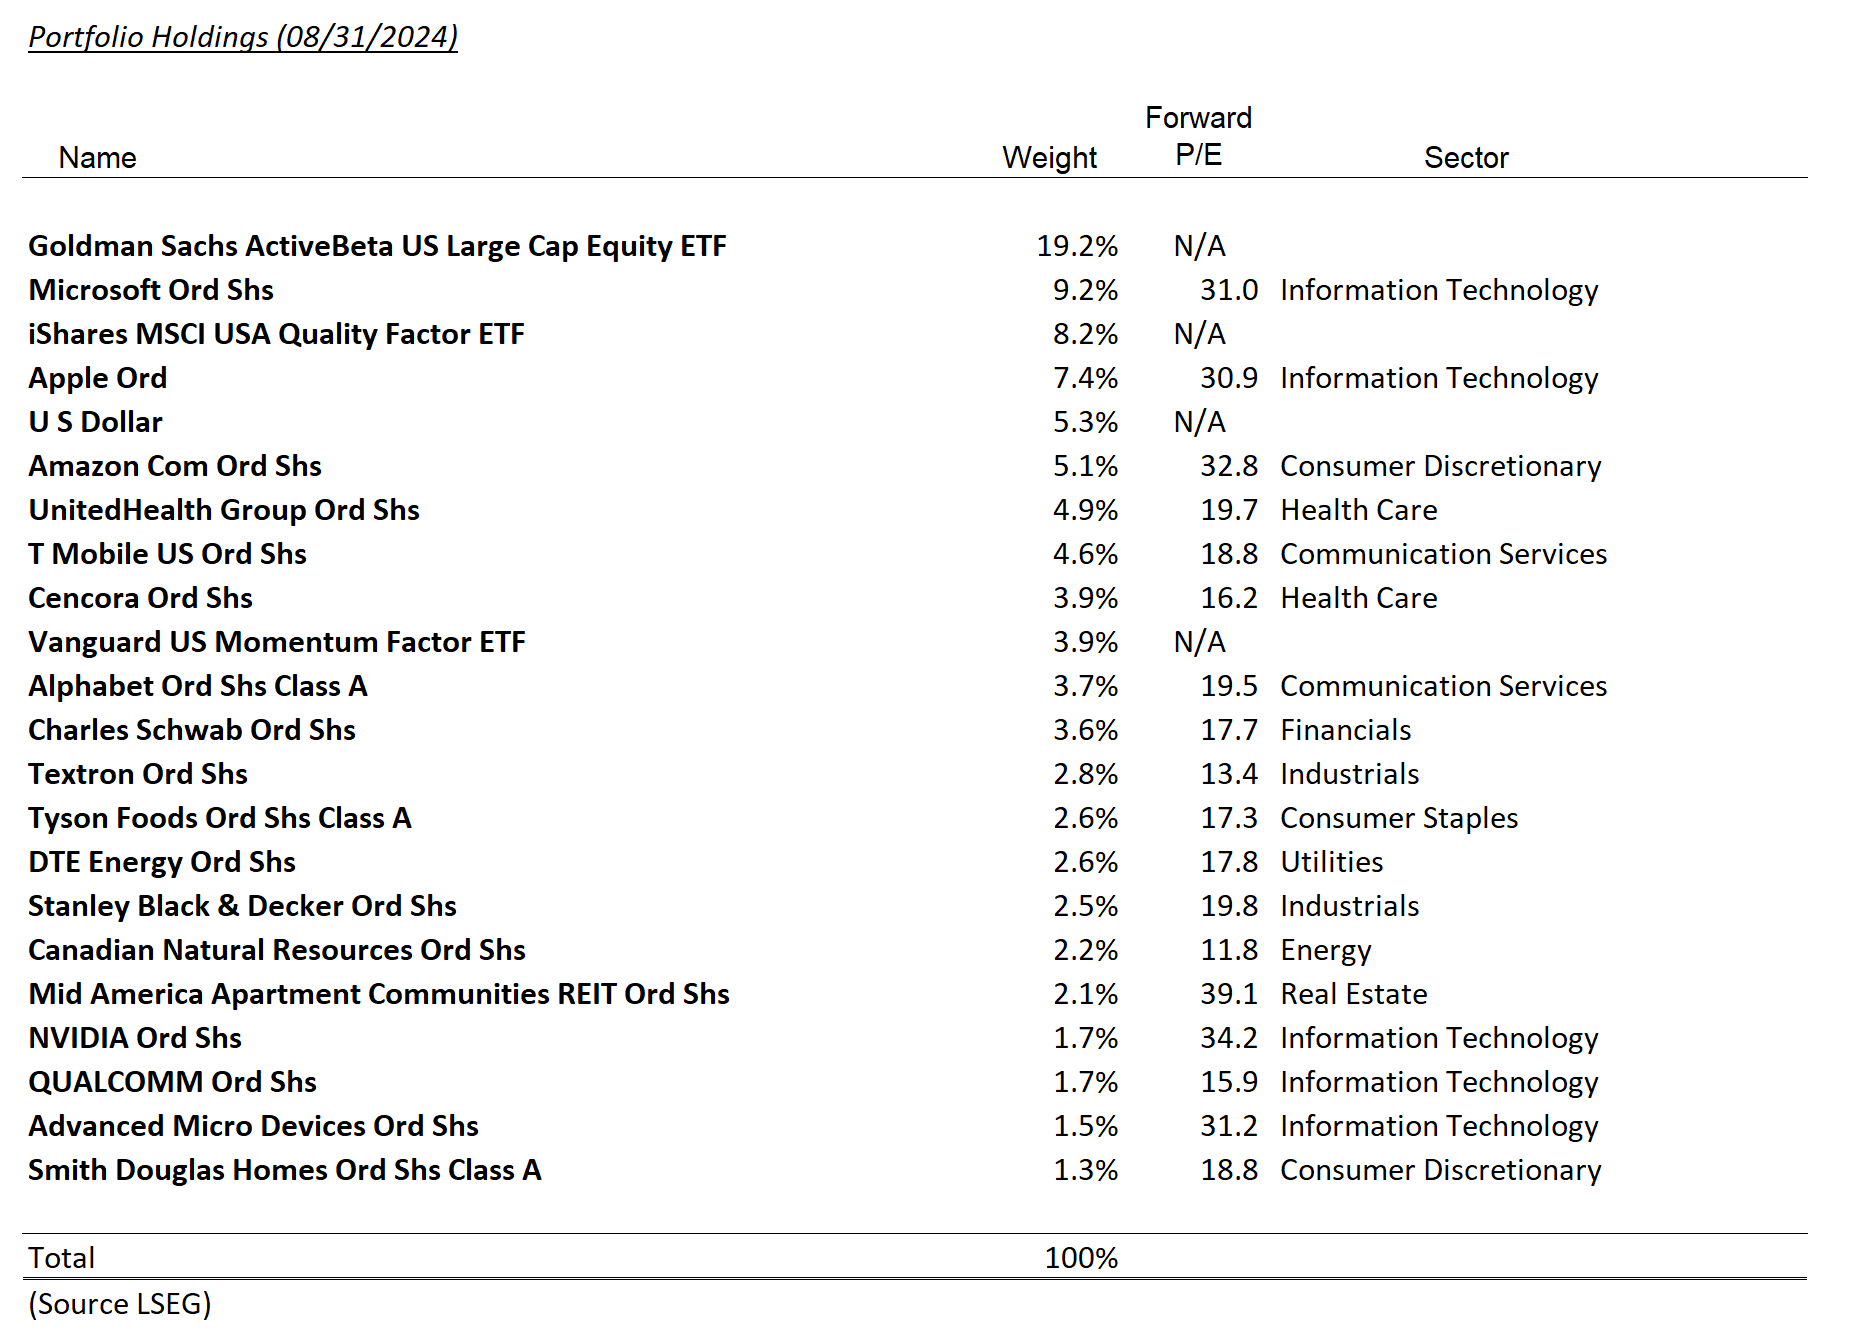
T-Mobile, Mid America Apartments, and Smith Douglas Homes were the top performers for the month, while Amazon, Stanley Black & Decker, and Textron were the biggest detractors from performance.
The market regained stability after a weak start to the month. Recession concerns, a plunge in Japanese markets, and a spike in the volatility index (VIX) triggered a sharp pullback at the beginning of August. To provide some context, the VIX reached 65 on August 5th—a level previously seen only during the financial crisis and in March 2020. A similar, though less severe, volatility spike occurred in February 2018, which resulted in a 10% market decline and took six months for the market to recover its previous highs.
Many hedge funds hold ‘short volatility’ positions, and a spike of this magnitude would typically lead to losses and a period of deleveraging. However, there appears to have been no significant collateral damage. The drop in the Nikkei Index also had the potential to create ripple effects across banking and financial markets, but once again, the impact has been minimal. It seems we have moved past the point of concern regarding these events, which may have helped to reduce excess risk in the market.
As September begins, the market has once again stumbled out of the gate. Despite some attributing the 2% drop in the S&P 500 to the ISM manufacturing index, we believe the report wasn’t severe enough to justify such a decline. Economic data will be crucial as we head into the fall, with this month’s payroll report taking on added significance for its potential impact on the Federal Reserve’s rate decision in September. Given current valuations and an uncertain macroeconomic outlook, a defensive stance remains prudent.
Shifting to Defense: JPMorgan Sold Amid Over-Earning Concerns
We decided to sell our position in JP Morgan Chase & Co. (JPM), helping to shift our portfolios into a more defensive stance. Banks are often viewed as leveraged bets on the global economy, and JPMorgan, in particular, is currently over-earning. The bank’s strong performance is largely due to a favorable, though still rising, credit loss environment and deposit costs that have not yet aligned with elevated short-term rates. While we hold both the bank and its management in high regard, we believe our capital can be better allocated elsewhere as we approach a slowing economy.
Capitalizing on SDHC Volatility Spike
In August, we sold some shares of Smith Douglas Homes Corp. (SDHC) from tax sheltered accounts. Despite a market cap close to $2 billion, SDHC has a limited number of publicly traded shares, with 80% still owned by the founders. This structure fosters strong alignment between management and minority shareholders but can also contribute to higher volatility for SDHC shares. The stock’s reaction to Q2 earnings was more favorable than we felt was warranted, providing an opportunity to sell part of our position, with plans to repurchase at a lower price.


Disclosures
The views expressed represent the opinions of Lincoln Capital Corporation as of the date noted and are subject to change. These views are not intended as a forecast, a guarantee of future results, investment recommendation, or an offer to buy or sell any securities. The information provided is of a general nature and should not be construed as investment advice or to provide any investment, tax, financial or legal advice or service to any person. The information contained has been compiled from sources deemed reliable, yet accuracy is not guaranteed.
Additional information, including management fees and expenses, is provided on our Form ADV Part 2 available upon request or at the SEC’s Investment Adviser Public Disclosure website.
Past performance is not a guarantee of future results. Please note that due to rounding differences, certain data presented may not sum to 100%.
The investments presented are examples of the securities held, bought and/or sold in Lincoln Capital Corporation strategies during the last 12 months. These investments may not be representative of the current or future investments of those strategies. You should not assume that investments in the securities identified in this presentation were or will be profitable. We will furnish, upon your request, a list of all securities purchased, sold or held in the strategies during the 12 months preceding the date of this presentation. It should not be assumed that recommendations made in the future will be profitable or will equal the performance of securities identified in this presentation. Lincoln Capital Corporation or one or more of its officers or employees, may have a position in the securities presented, and may purchase or sell such securities from time to time.

