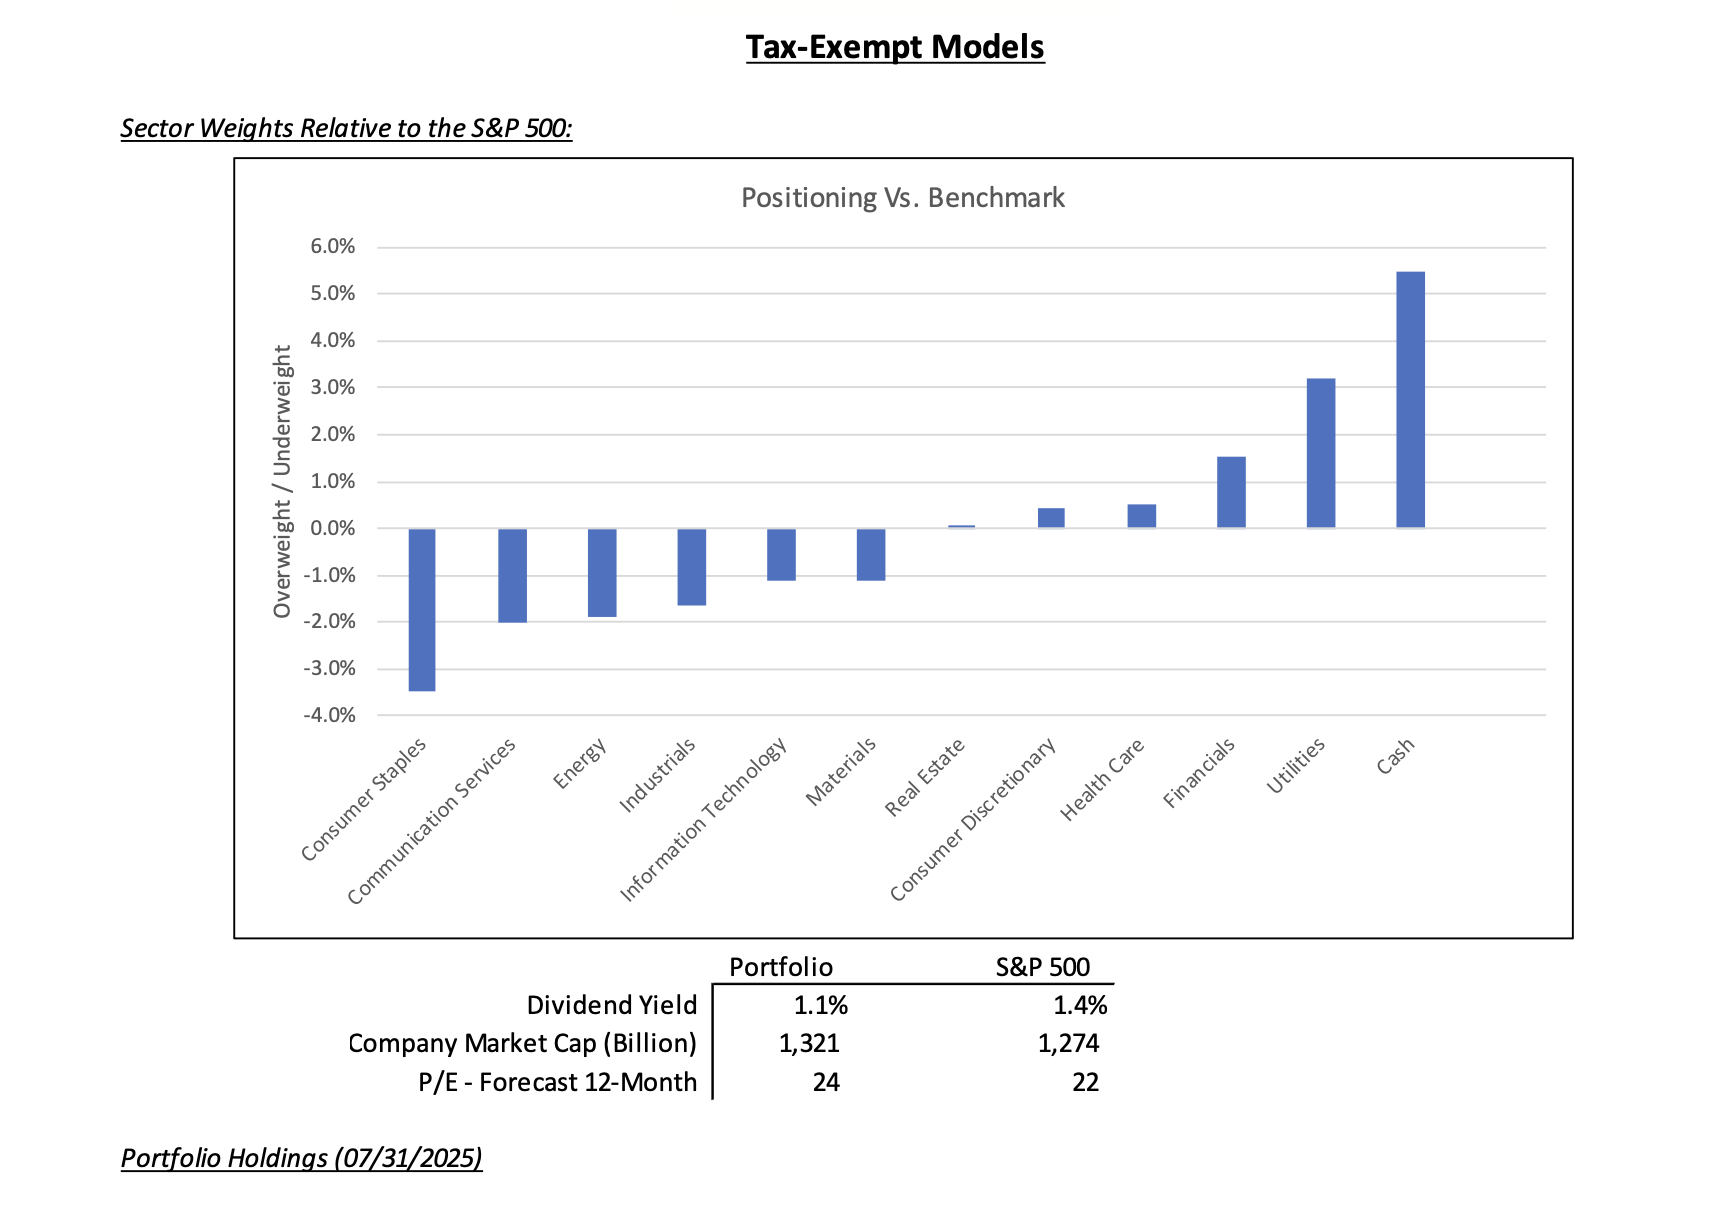
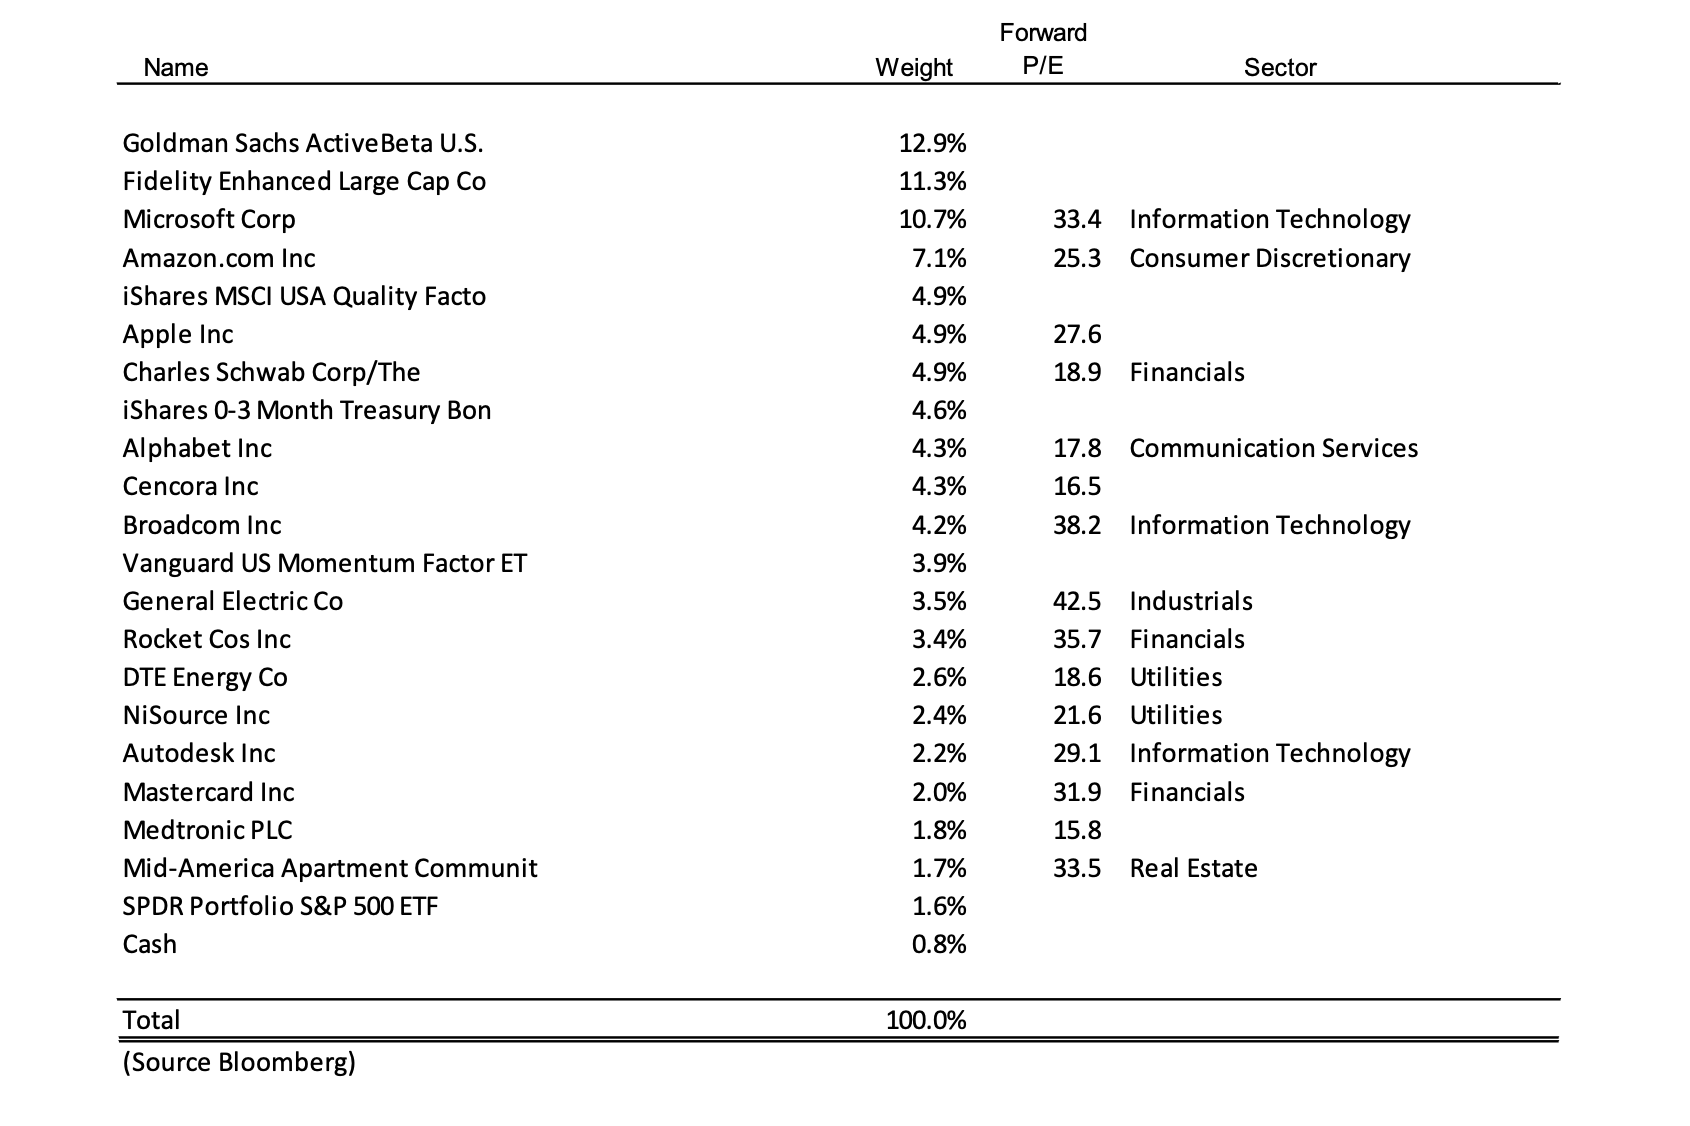
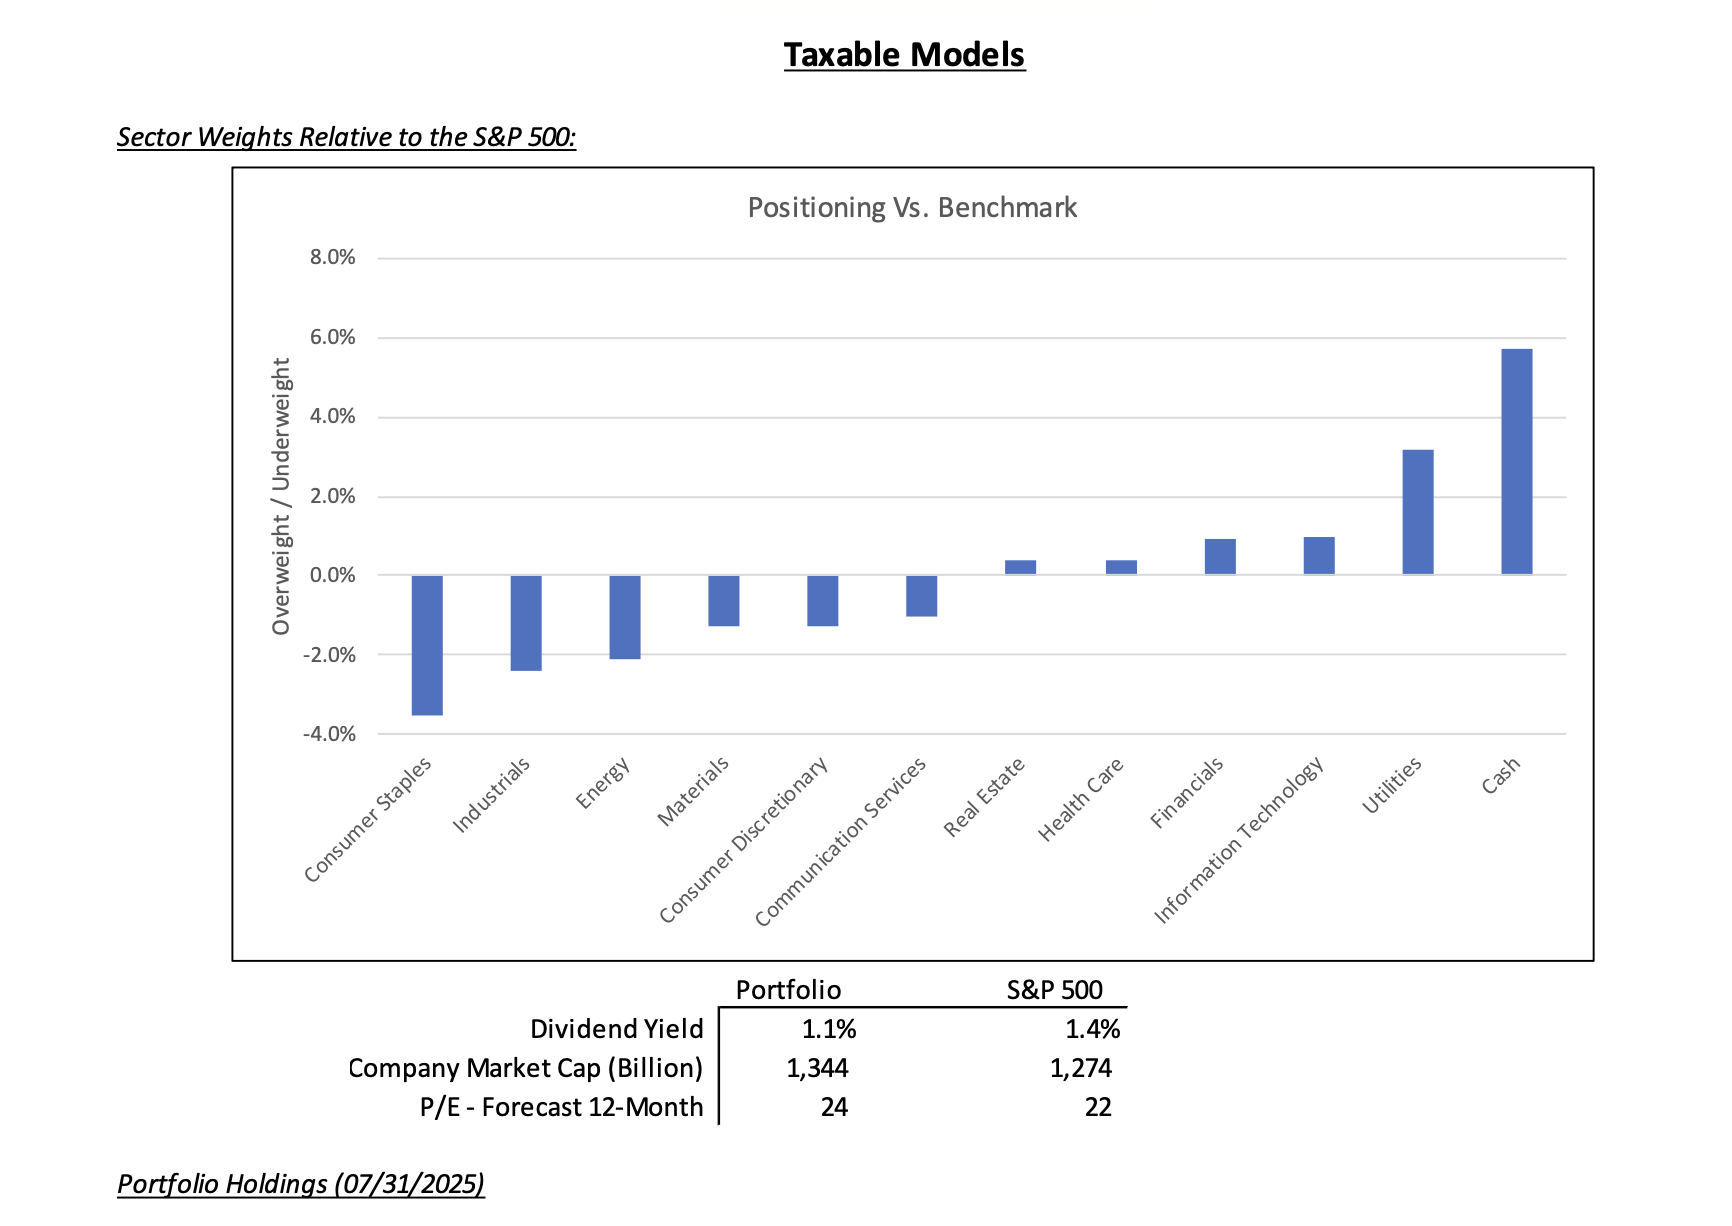
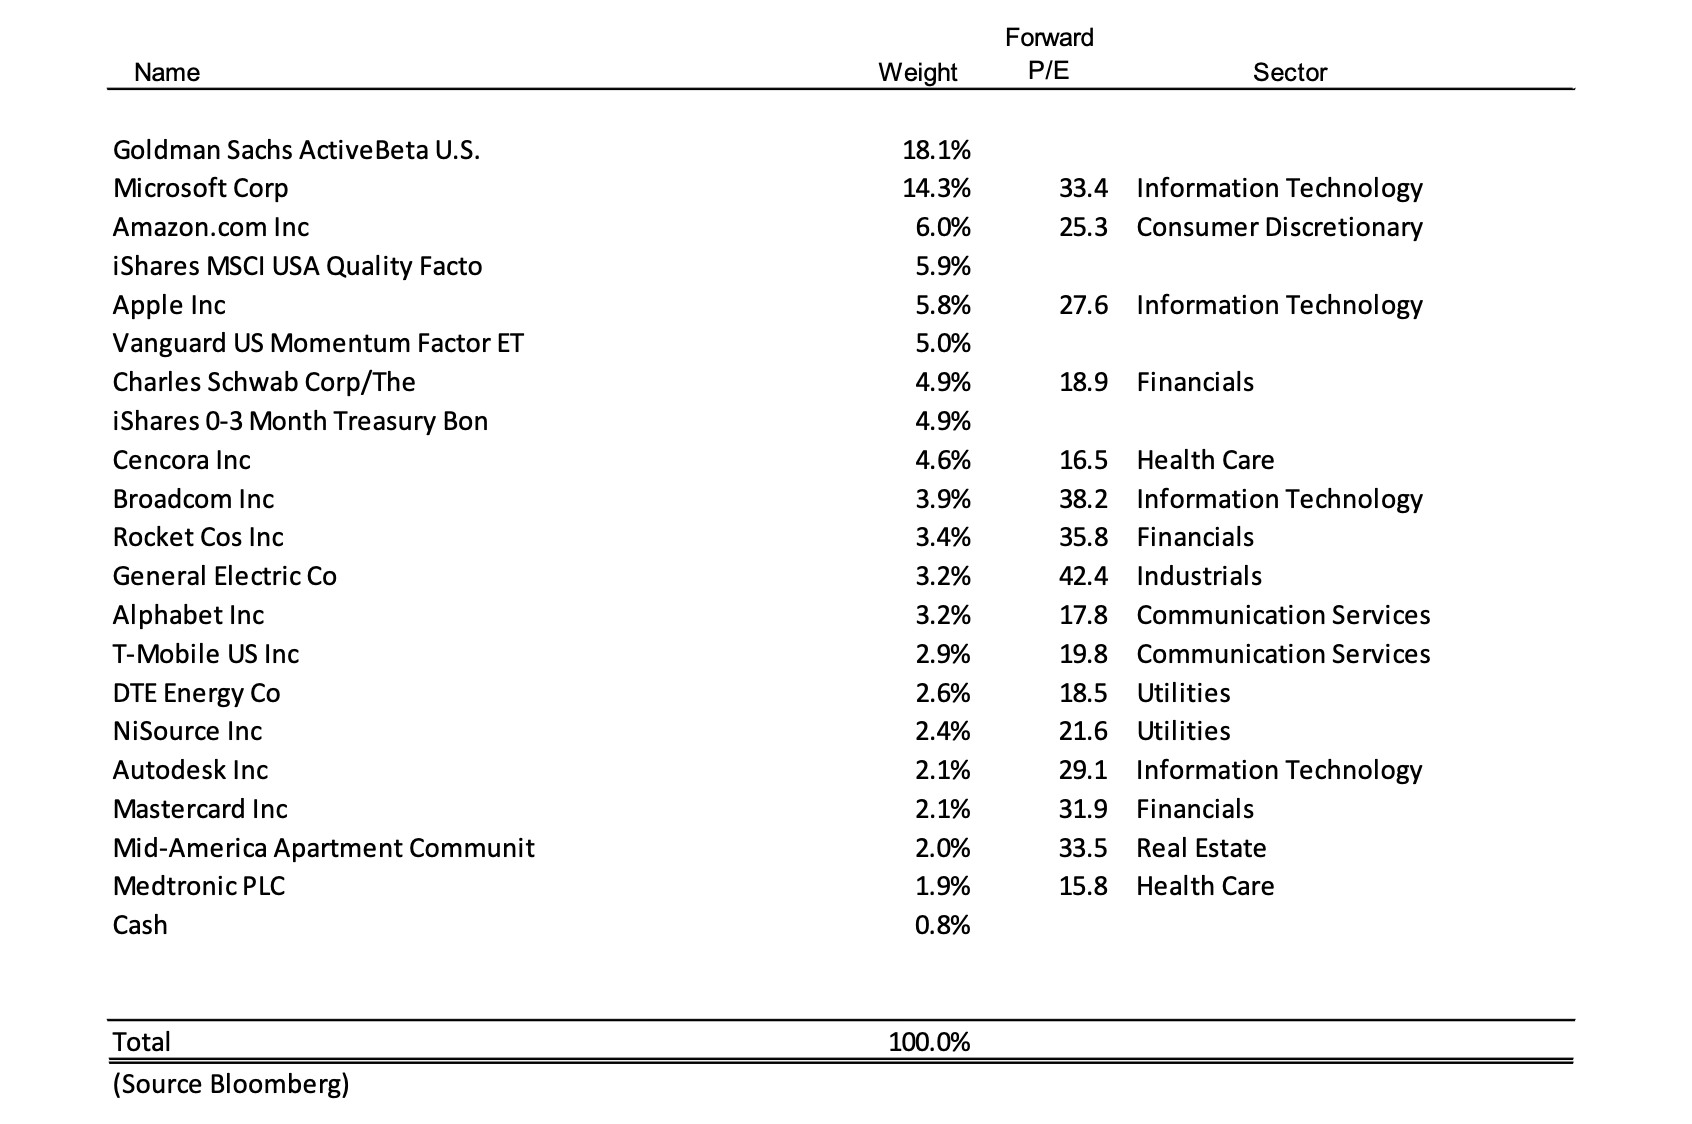
July Changes
Tax Deferred
(for mobile swipe left to right)
| New Additions | Complete Sales | Partial Sales | Additional Buys | % of Account Traded |
|---|---|---|---|---|
| TMUS | 3.0% |
Taxable
(for mobile swipe left to right)
| New Additions | Complete Sales | Partial Sales | Additional Buys | % of Account Traded |
|---|---|---|---|---|
| TMUS | 1.9% |
Summary of Month’s Action
U.S. equities, as measured by the S&P 500 Index, posted a solid gain of 2.2% in July. Leading sectors included Information Technology, Utilities, and Industrials, while Health Care, Consumer Staples, and Materials underperformed.
Key contributors to client portfolios in July were Microsoft, Charles Schwab, and Amazon.com. Detractors included Cencora and Autodesk.
Microsoft: Strong Results Validate Cloud Investment
Microsoft delivered an excellent quarterly report on July 30, pushing shares up 7.3% for the month. Over the past year, investors have closely monitored the aggressive infrastructure spending by cloud providers, raising concerns over whether such outlays would be justified by business demand.
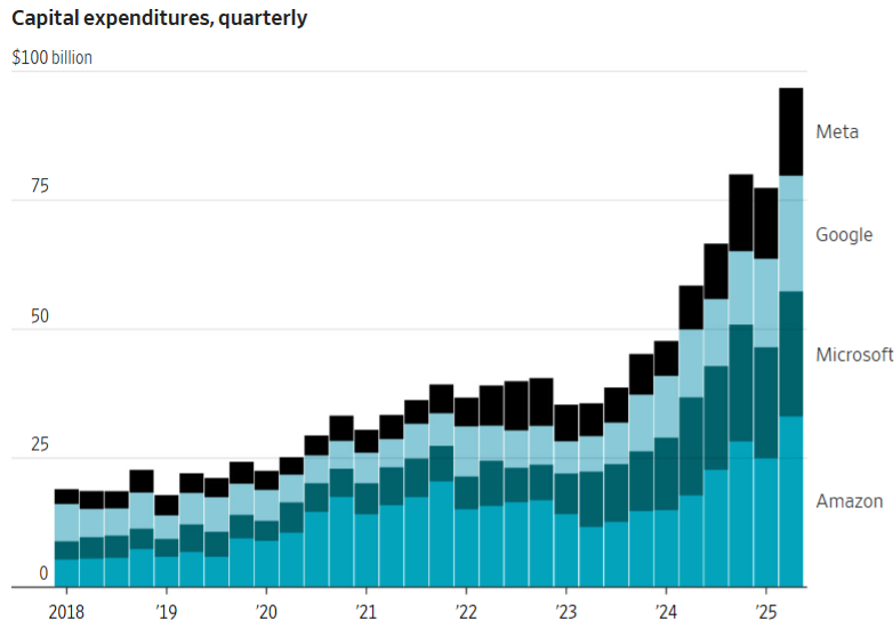
In its fiscal Q4 results, Microsoft eased those fears: Azure and other cloud services posted 39% revenue growth, up from 35% in the prior quarter. This level of acceleration is remarkable for a business nearing $75 billion in size. Microsoft continues to be well-positioned as both a platform for AI-native businesses and a key enabler for companies integrating AI into existing workflows.
Charles Schwab: Cash Sorting Fears Fade
Charles Schwab also performed well following an encouraging update on business trends. After multiple false starts, the so-called “cash sorting” issue that arose during the 2023 banking crisis finally appears to be in the past.
The firm’s use of costly supplemental borrowing has declined 71% since peaking in May 2023, driven by stabilized client cash allocations and growth in new sweep deposits. While Schwab may experience another quarter or two of balance sheet shrinkage, it is nearing a point where it can resume expansion. With current securities yielding ~2%, compared to today’s market rate of ~4%, any new asset purchases should offer meaningful upside.
That said, with shares up 33% year-to-date, valuations are no longer as compelling. As Schwab approaches or exceeds our estimate of fair value, we may consider trimming the position in tax-exempt accounts.
T-Mobile (TMUS): Trimming a Strong Performer
During July, we exited our position in tax-exempt accounts and reduced our overweight position in taxable accounts. T-Mobile has served clients well, delivering a 96% total return since our initial investment in March 2021, compared to 72% for the S&P 500 over the same period.
At the time of purchase, the market was underestimating the value of synergies and free cash flow from the Sprint merger. Since then, free cash flow has grown substantially and so has the company’s valuation. Today, T-Mobile trades at a reasonable premium to AT&T and Verizon, reflecting its superior growth profile.
We continue to hold shares in taxable portfolios given the company’s strong management and high-quality business. However, should more attractive opportunities arise, we may look to T-Mobile as a source of funds.
Disclosures
The views expressed represent the opinions of Lincoln Capital Corporation as of the date noted and are subject to change. These views are not intended as a forecast, a guarantee of future results, investment recommendation, or an offer to buy or sell any securities. The information provided is of a general nature and should not be construed as investment advice or to provide any investment, tax, financial or legal advice or service to any person. The information contained has been compiled from sources deemed reliable, yet accuracy is not guaranteed.
Additional information, including management fees and expenses, is provided on our Form ADV Part 2 available upon request or at the SEC’s Investment Adviser Public Disclosure website.
Past performance is not a guarantee of future results. Please note that due to rounding differences, certain data presented may not sum to 100%.
The investments presented are examples of the securities held, bought and/or sold in Lincoln Capital Corporation strategies during the last 12 months. These investments may not be representative of the current or future investments of those strategies. You should not assume that investments in the securities identified in this presentation were or will be profitable. We will furnish, upon your request, a list of all securities purchased, sold or held in the strategies during the 12 months preceding the date of this presentation. It should not be assumed that recommendations made in the future will be profitable or will equal the performance of securities identified in this presentation. Lincoln Capital Corporation or one or more of its officers or employees, may have a position in the securities presented, and may purchase or sell such securities from time to time.

