October Changes
Tax Deferred
(for mobile swipe left to right)
| New Additions | Complete Sales | Partial Sales | Additional Buys | % of Account Traded |
|---|---|---|---|---|
| MA | 2.0% |
Taxable
(for mobile swipe left to right)
| New Additions | Complete Sales | Partial Sales | Additional Buys | % of Account Traded |
|---|---|---|---|---|
| MA | 2.0% |
Summary of Month’s Action
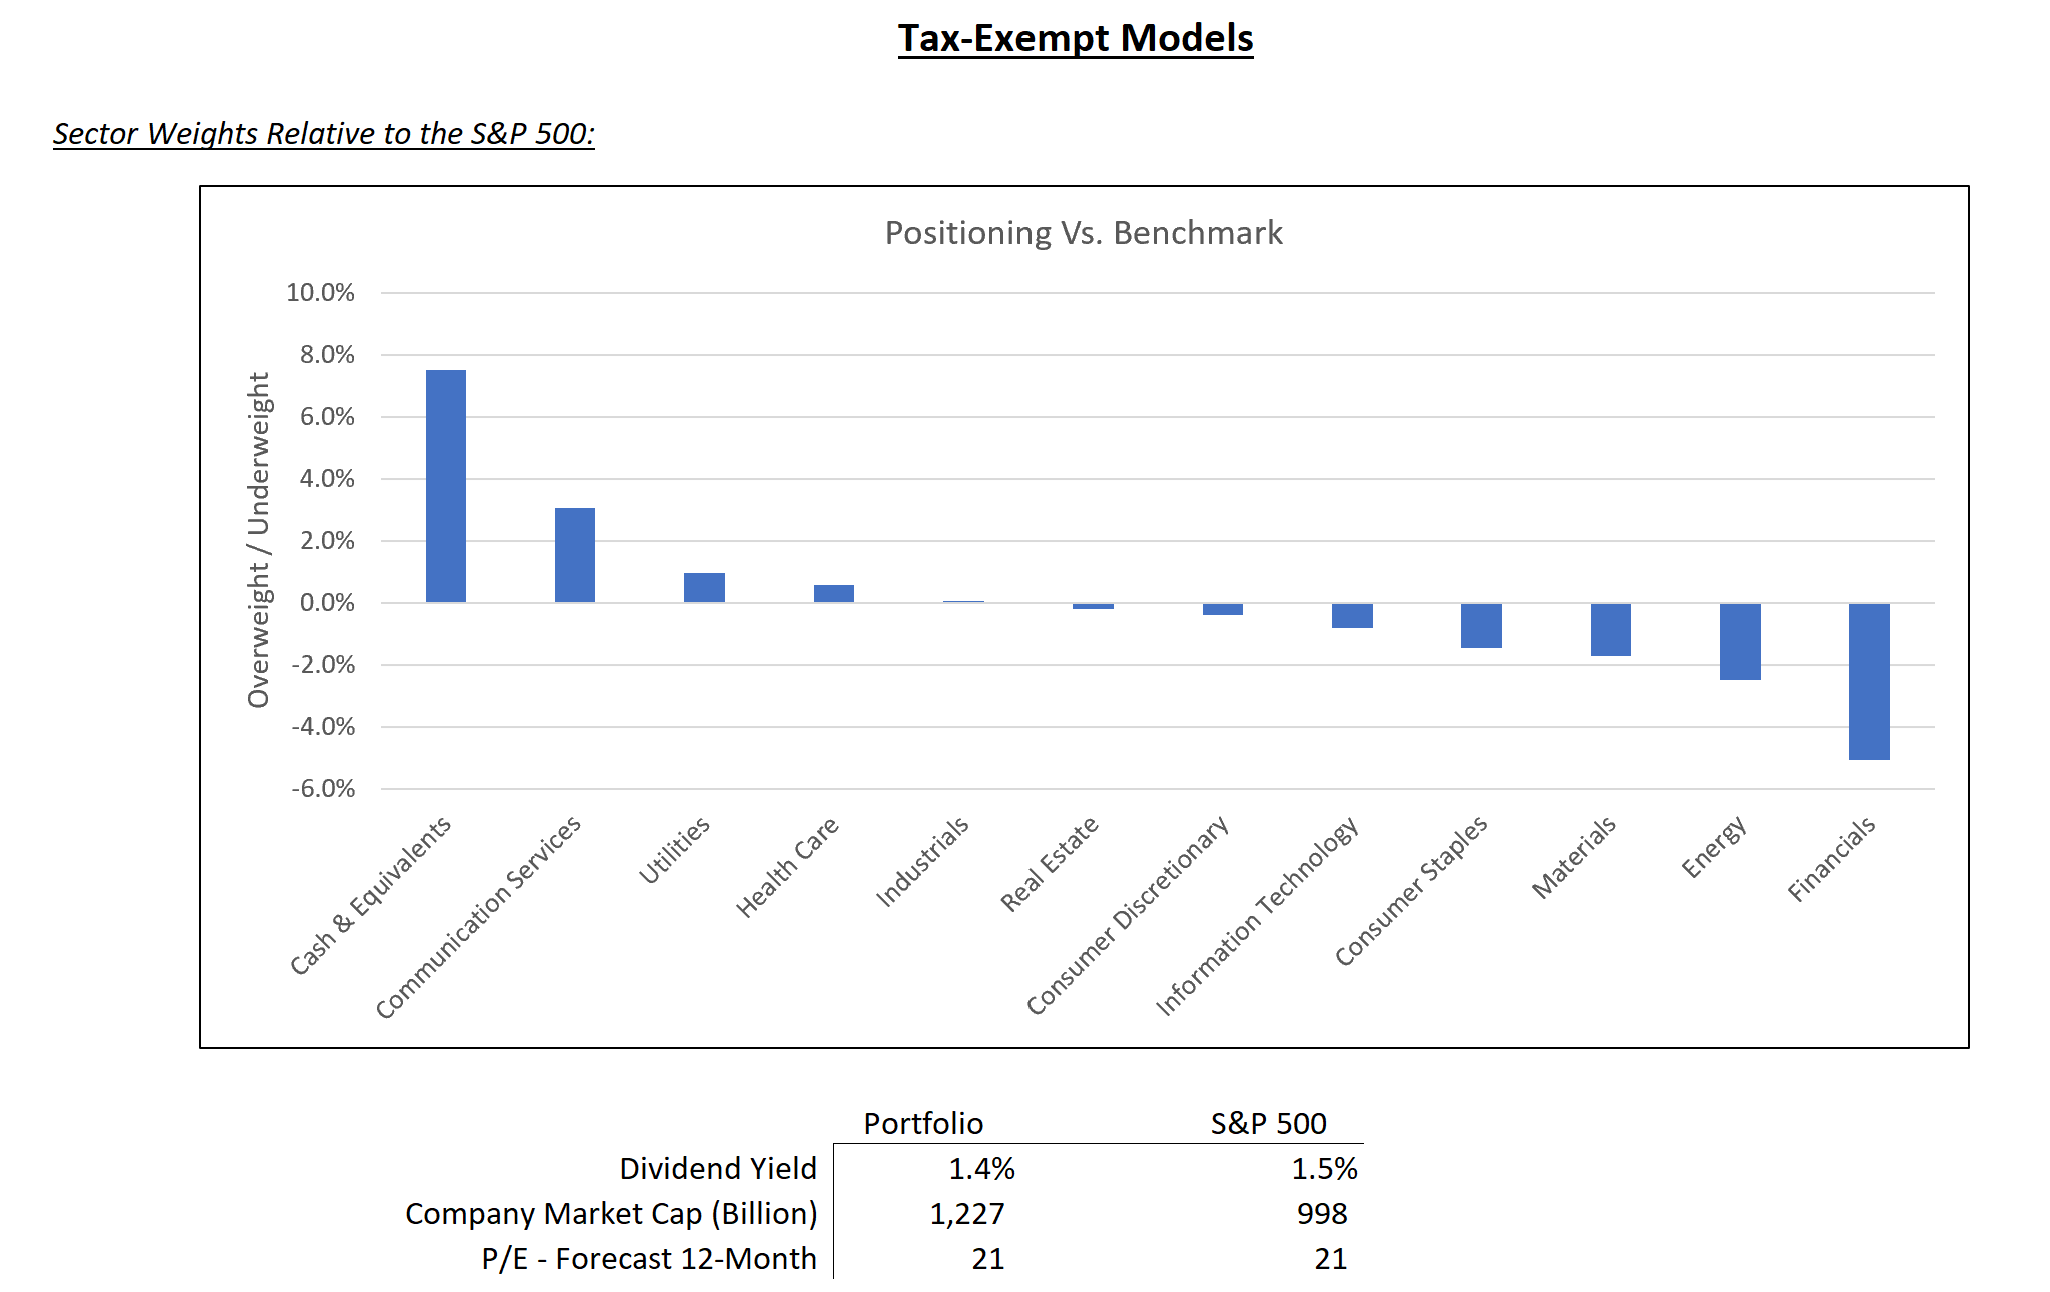
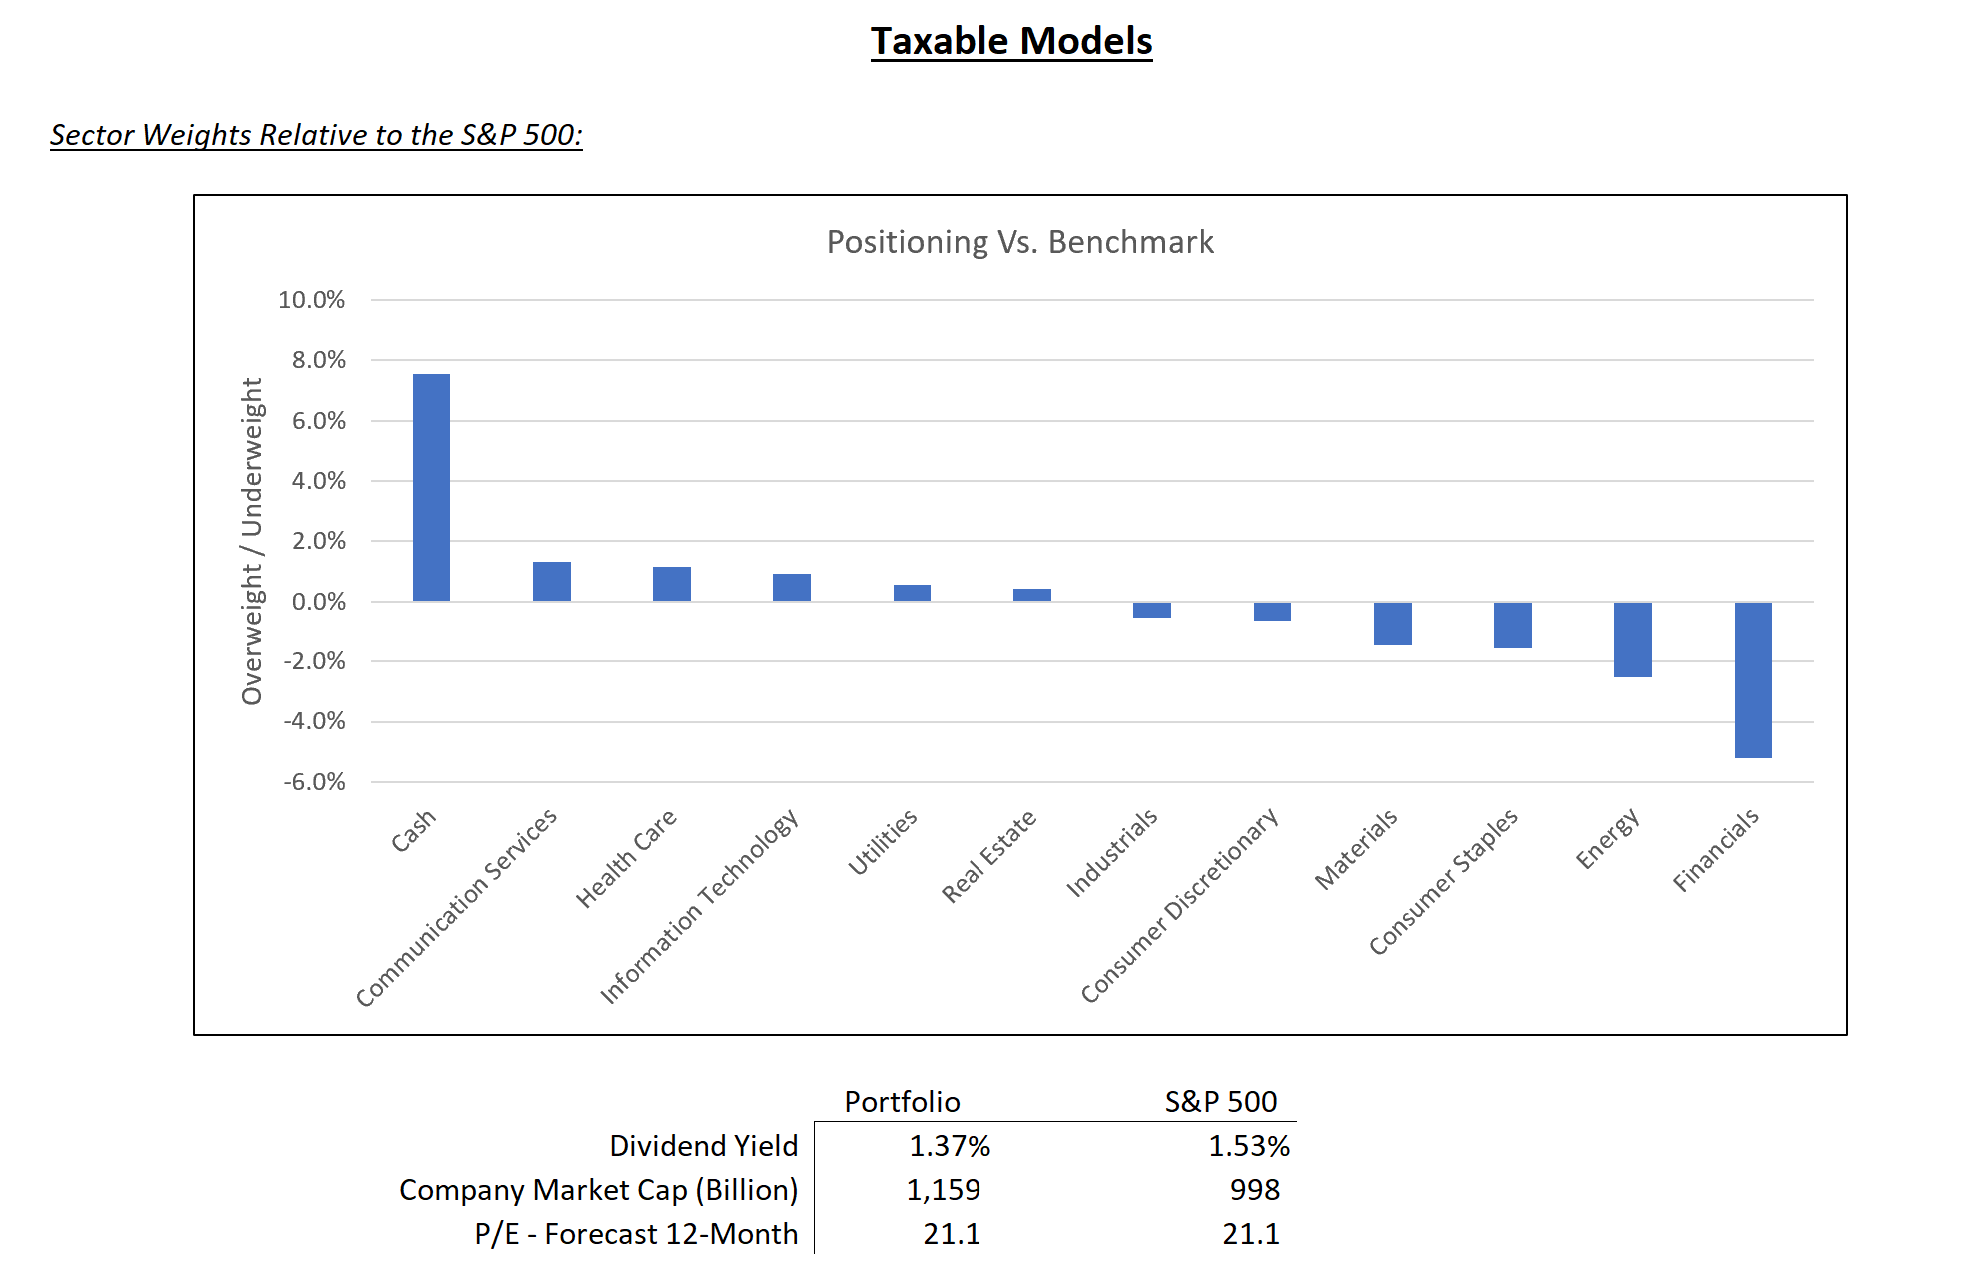
The S&P 500 ended October with negative returns, primarily impacted by a sell-off toward the end of the month. From a sector perspective, Financials, Communication Services, and Energy delivered the strongest performance, while Healthcare, Consumer Staples, and Real Estate lagged. All data sourced from Bloomberg.
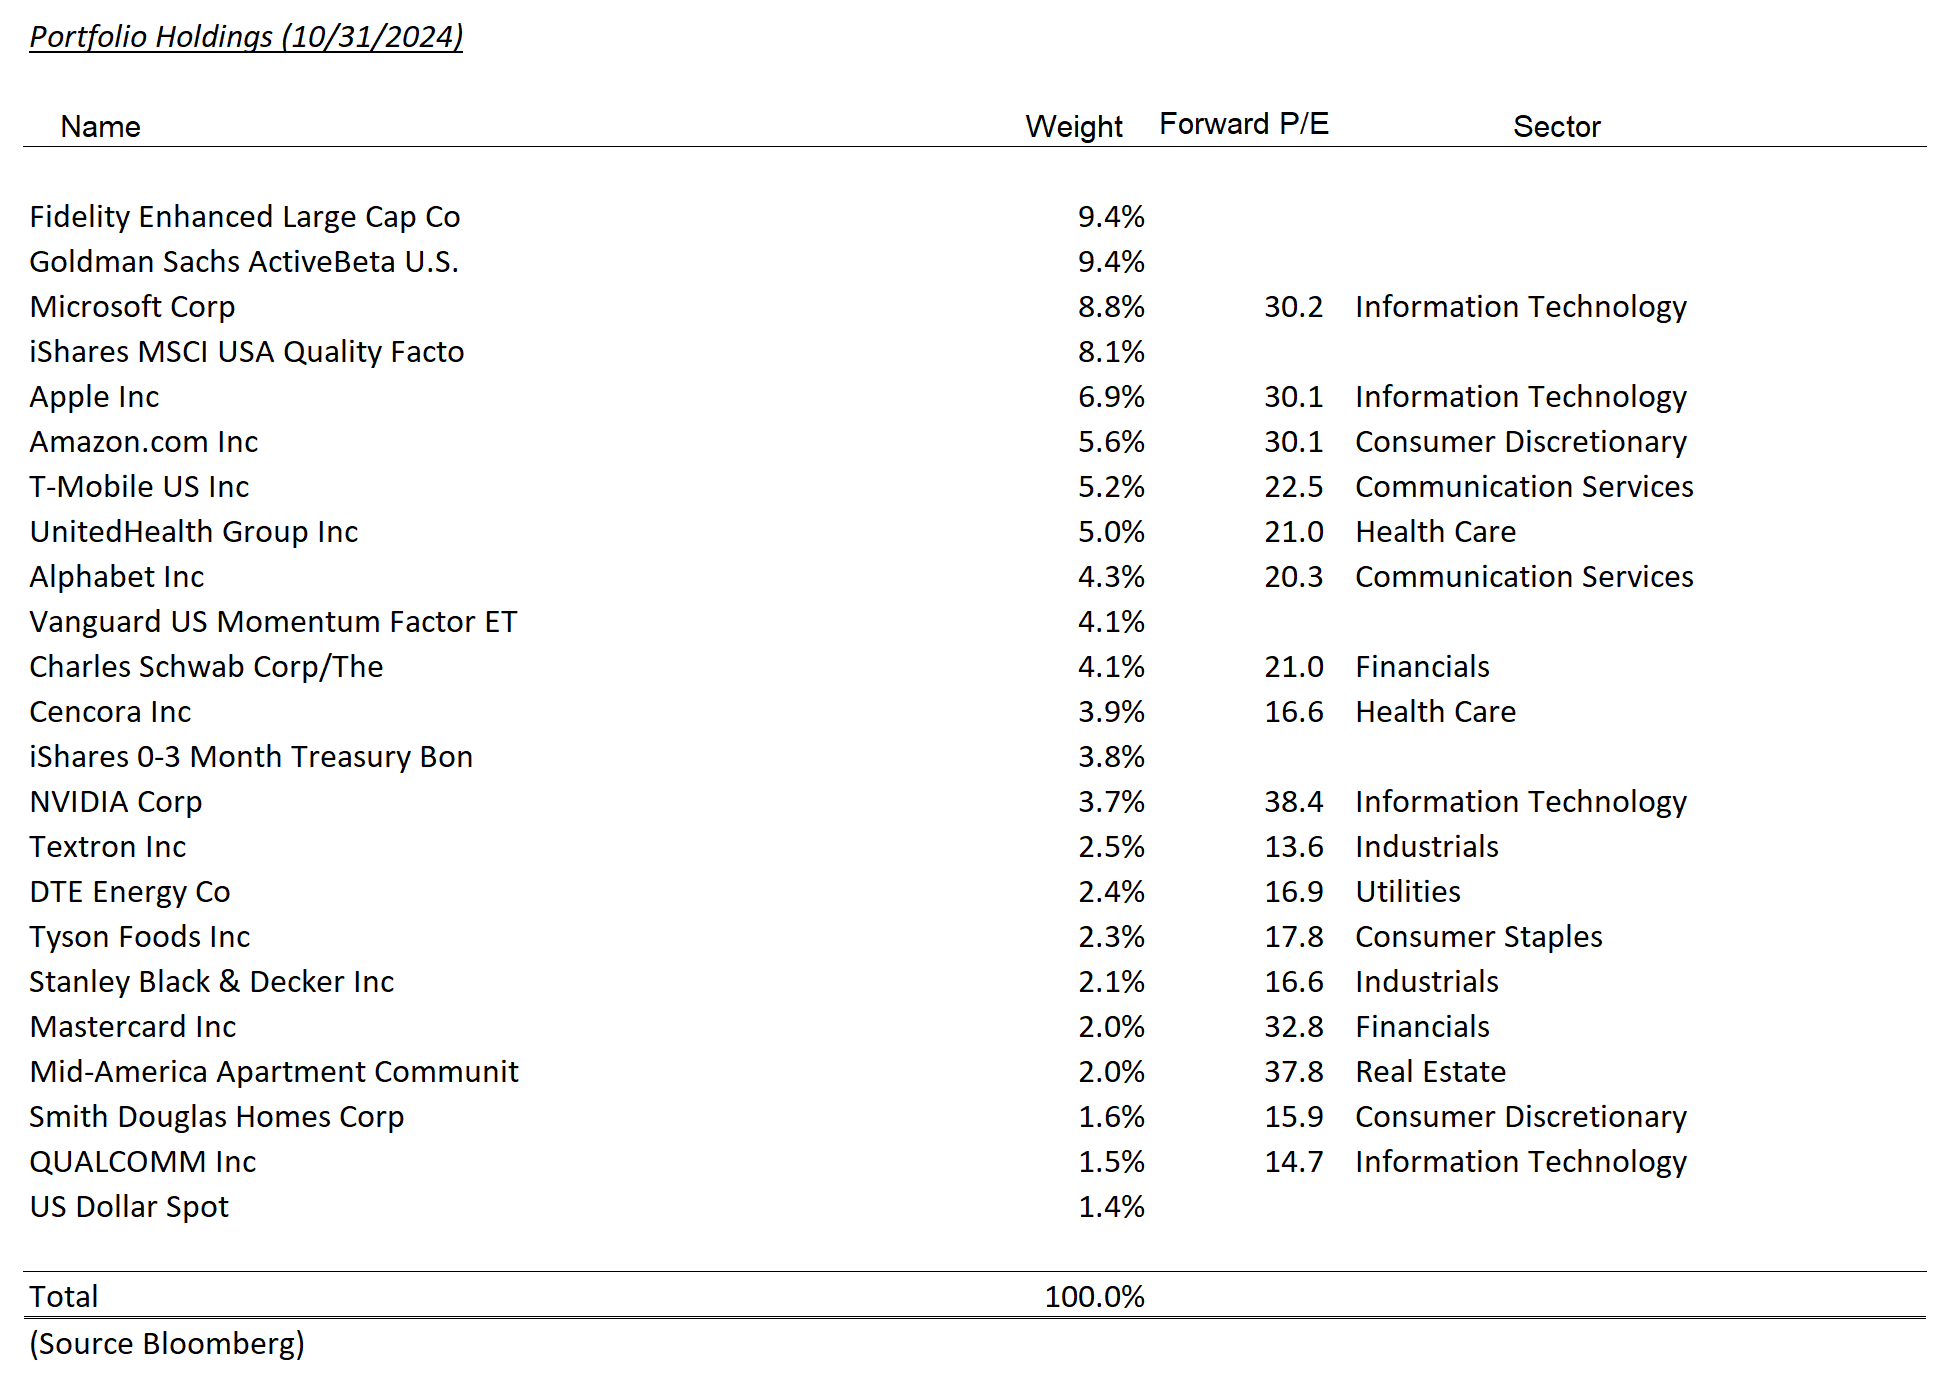
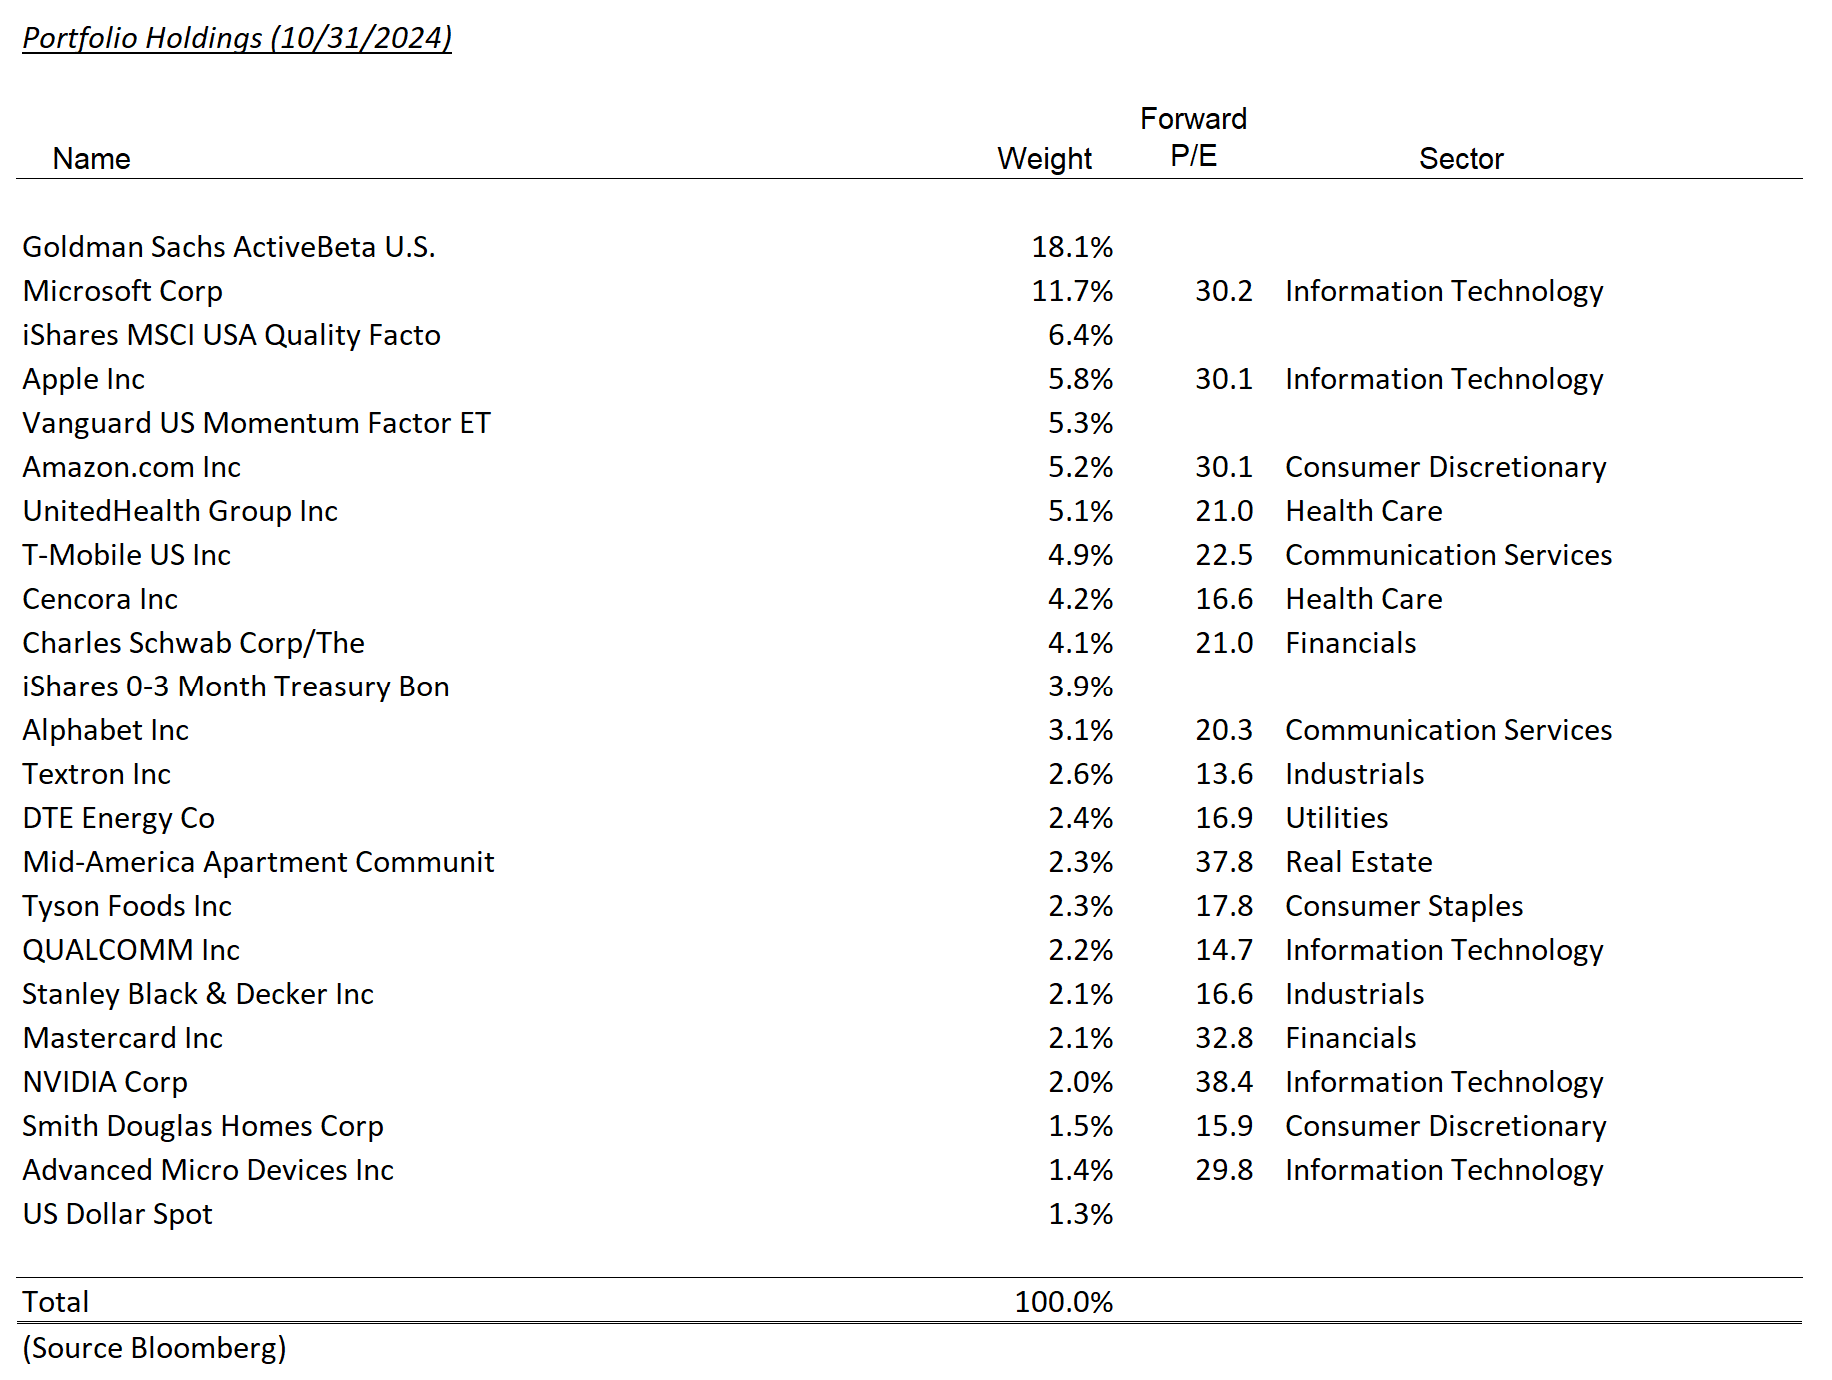
Notable gainers in October included T-Mobile (TMUS) and Charles Schwab (SCHW), with returns of 8.1% and 9.3%, respectively. T-Mobile continued to outperform Verizon and AT&T, benefiting from competitive service pricing and a superior network, as reflected in its recently reported third-quarter results. Another development is Deutsche Telekom’s (DT) new intention to use future cash flows to buy back its own stock and potentially increase its stake in TMUS. With DT potentially competing with T-Mobile’s buyback program to acquire shares, the outlook for TMUS’s share price remains favorable.
While Charles Schwab (SCHW) has been challenging, the latest quarter showed promising signs. The company experienced robust cash inflows in September, reducing its need for costly short-term borrowing. We have long anticipated that ‘cash sorting’ (moving cash from low-yield bank sweeps earning 0.45% to higher-yield alternatives) would normalize. With this trend showing early signs of stabilization, Schwab may be positioned to pay down high-cost debt and invest in higher-yielding assets.
Stanley Black & Decker and Textron underperformed, both reporting weaker-than-expected earnings. Stanley Black & Decker’s margin recovery plan appears to be progressing more slowly than anticipated. Textron faced a tough quarter due to a strike at its Wichita Cessna plant, which has since been resolved, but the greater concern may be the downward revision in its specialized vehicle segment (Arctic Cat).
Strengthening Portfolios with Mastercard (MA): A Global Payment Leader
While not reflected in the tables that follow below, we introduced Mastercard to client portfolios in early November. As a well-established and globally recognized brand, Mastercard is one half of the global payments duopoly, processing credit and debit transactions across 210+ countries in over 150 currencies. Last year, transactions involving Mastercard brands totaled $9 trillion.
Although the shift from cash to card payments continues in developed markets, this trend is expected to moderate compared to the past decade. With only 30% of Mastercard’s transaction volume generated in the U.S., Mastercard remains a highly international company.
Mastercard’s business benefits from robust network effects, particularly for cross-border transactions, making it exceptionally difficult to disrupt. Additionally, over 35% of its revenue comes from non-payment services, including cybersecurity, data analytics, processing, and payment gateways.
This addition helps reduce our underweight in Financials, aligns the portfolio defensively—Mastercard is likely to outperform other Financials in a low-growth environment—and introduces a high-quality company with a reasonable valuation.
Tear Sheets
Disclosures
The views expressed represent the opinions of Lincoln Capital Corporation as of the date noted and are subject to change. These views are not intended as a forecast, a guarantee of future results, investment recommendation, or an offer to buy or sell any securities. The information provided is of a general nature and should not be construed as investment advice or to provide any investment, tax, financial or legal advice or service to any person. The information contained has been compiled from sources deemed reliable, yet accuracy is not guaranteed.
Additional information, including management fees and expenses, is provided on our Form ADV Part 2 available upon request or at the SEC’s Investment Adviser Public Disclosure website.
Past performance is not a guarantee of future results. Please note that due to rounding differences, certain data presented may not sum to 100%.
The investments presented are examples of the securities held, bought and/or sold in Lincoln Capital Corporation strategies during the last 12 months. These investments may not be representative of the current or future investments of those strategies. You should not assume that investments in the securities identified in this presentation were or will be profitable. We will furnish, upon your request, a list of all securities purchased, sold or held in the strategies during the 12 months preceding the date of this presentation. It should not be assumed that recommendations made in the future will be profitable or will equal the performance of securities identified in this presentation. Lincoln Capital Corporation or one or more of its officers or employees, may have a position in the securities presented, and may purchase or sell such securities from time to time.
