June Summary
Summary of Month’s Action
The S&P 500 gained 3.6% during the month of June. Interestingly, of the eleven S&P 500 sectors, only information technology and consumer discretionary outperformed the index, while the remaining nine underperformed. Major laggards include utilities and materials. Performance numbers sourced from Koyfin.
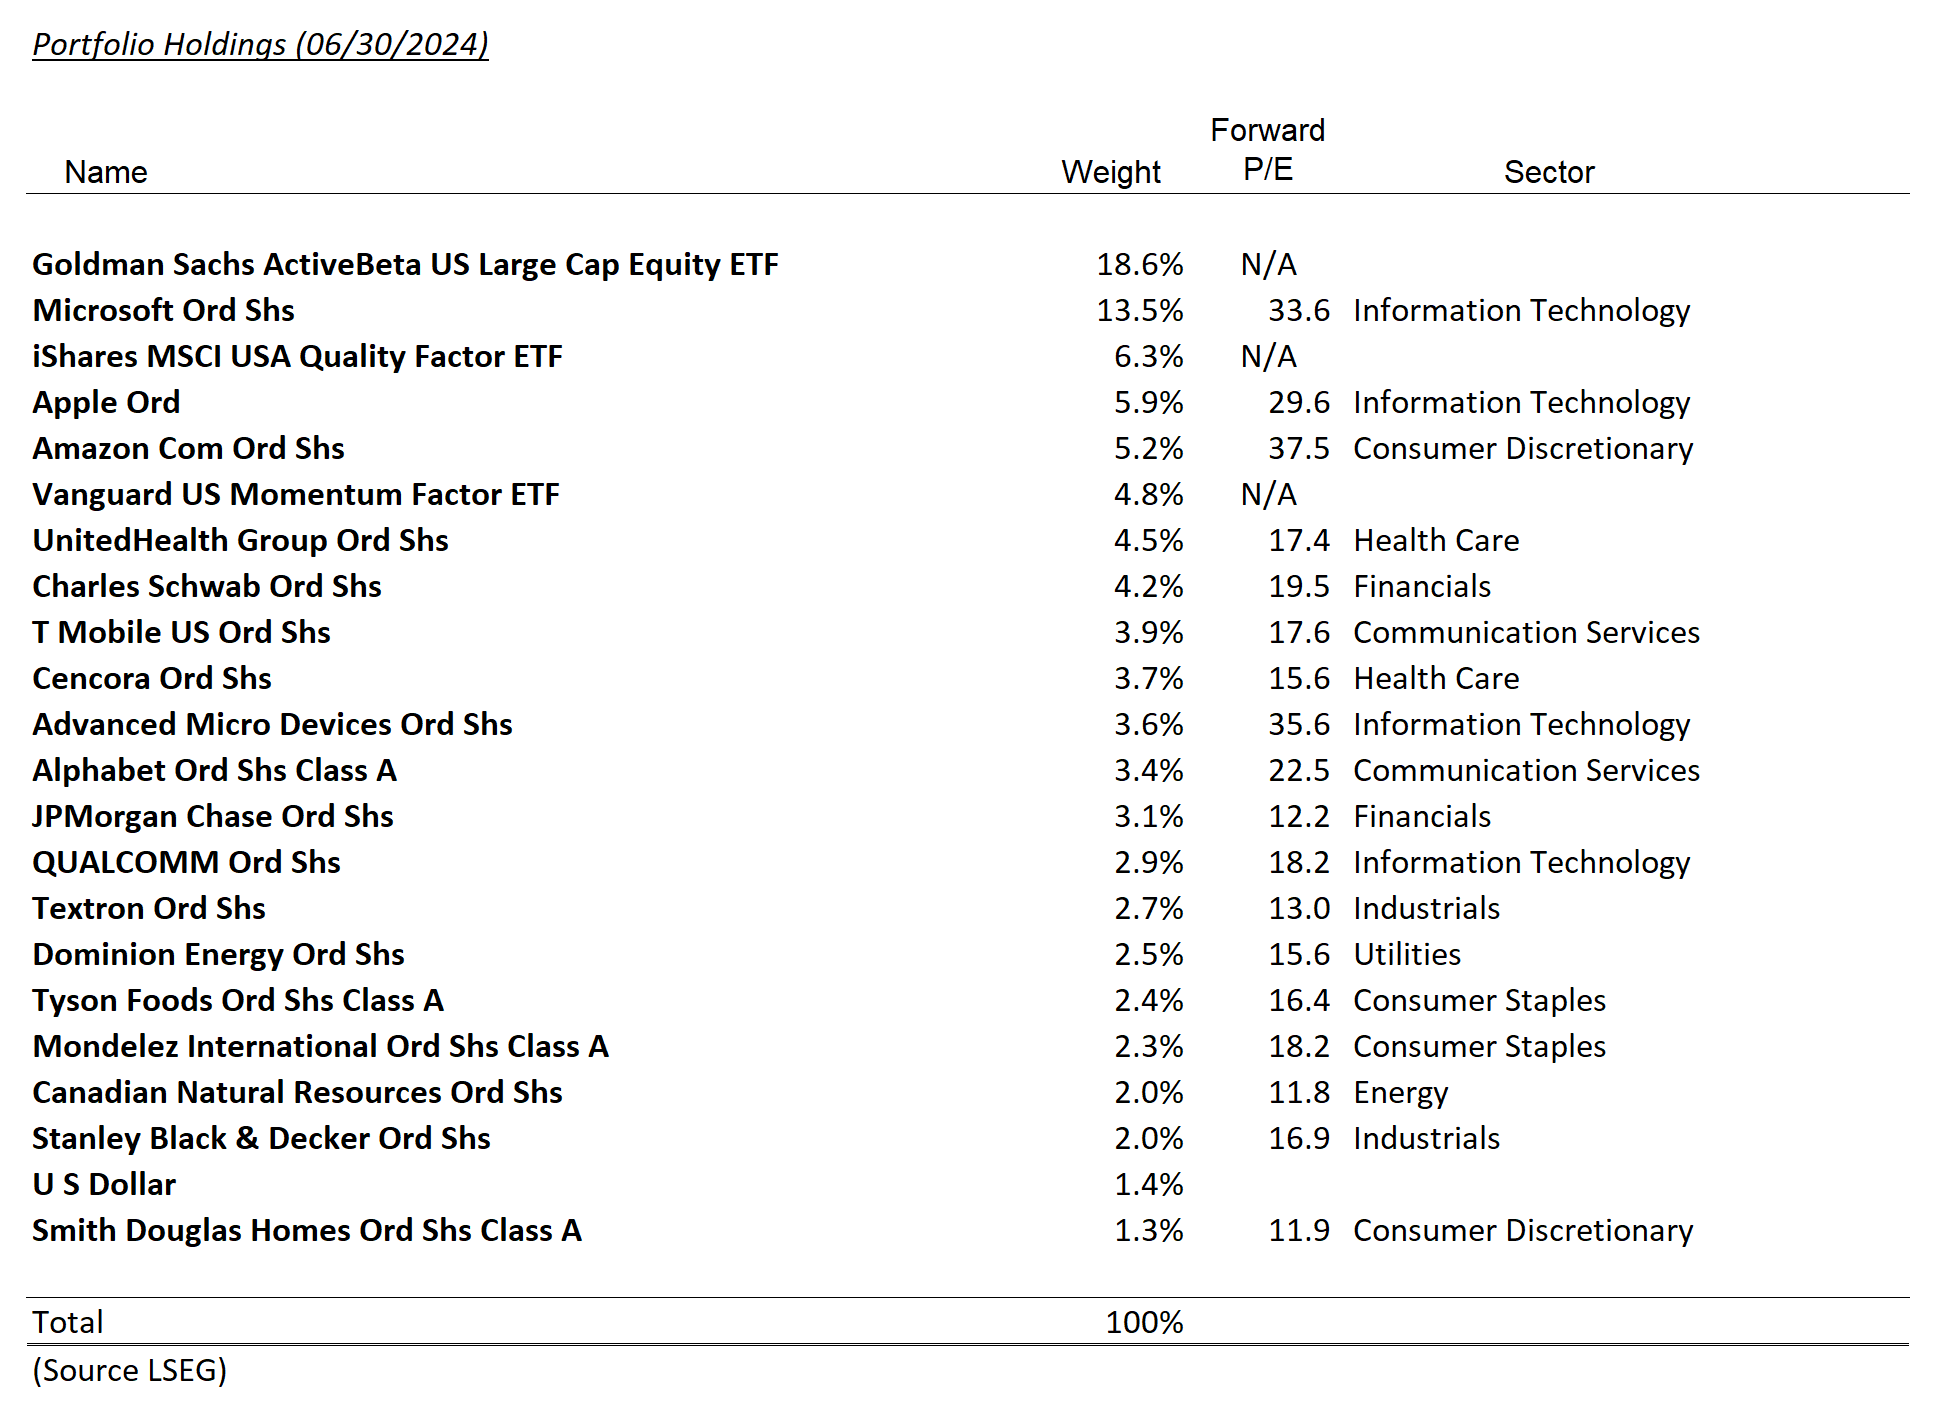
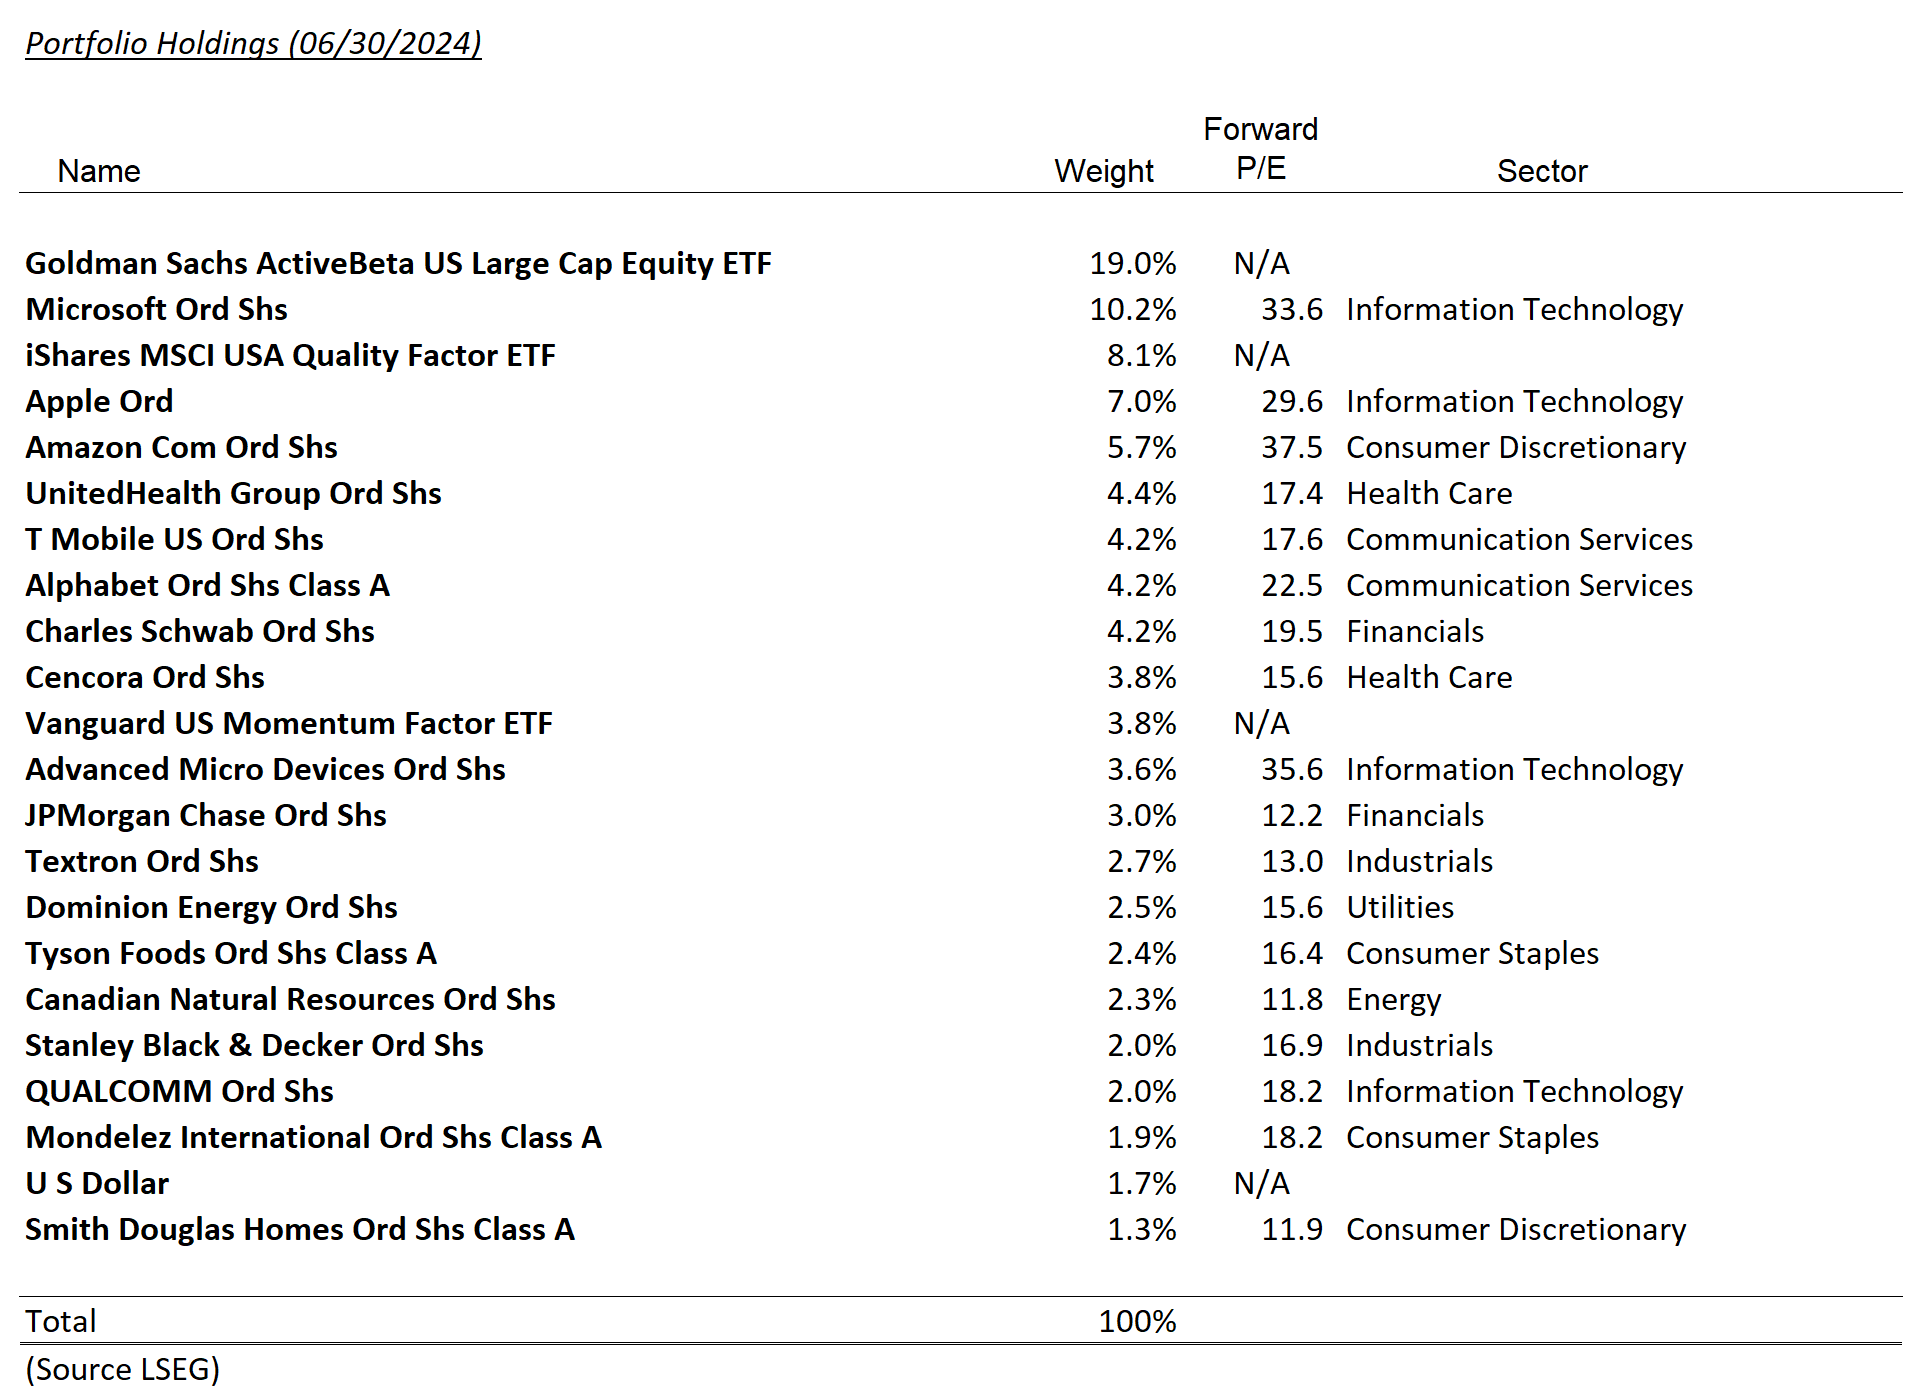
Microsoft, Amazon, and Apple were top contributors to client performance during the month. Apple hosted their annual Worldwide Developers Conference in mid-June. The stock initially shrugged at the event, which was widely anticipated to include updates on Apple’s Generative AI strategy. The days that followed saw the shares surge as investors more fully appreciated the offering. ‘Apple intelligence’ (as the AI tools are dubbed) will do some computations on device and some inside Apple data centers, while relying on Open AI and other large language models (LLMs) for other tasks. Announcements of collaboration with other LLM providers are expected soon, which sets Apple up as a key gatekeeper for which models get distributed to over 1 billion devices.
Additionally, details emerged that OpenAI will not be paid for providing Apple users responses; rather, it appears they are being compensated via the vast distribution of Apple devices. Premium OpenAI subscribers can link their phones to their Open AI accounts. It is also expected that users can subscribe to premium OpenAI tiers on their phone, allowing Apple the ability to monetize this offering via their typical app store commission. Therefore, instead of just seeing more phone sales from this technology, Apple will also likely see recurring high margin services sales as well.
Laggards for the month include Dominion Energy, Stanley Black and Decker, and Canadian Natural Resources. The moves of these securities were relatively modest, and there were no material news items about them.
Further analysis about the outlook for the equity market and the economy will follow with our upcoming Quarterly Tally.


Disclosures
The views expressed represent the opinions of Lincoln Capital Corporation as of the date noted and are subject to change. These views are not intended as a forecast, a guarantee of future results, investment recommendation, or an offer to buy or sell any securities. The information provided is of a general nature and should not be construed as investment advice or to provide any investment, tax, financial or legal advice or service to any person. The information contained has been compiled from sources deemed reliable, yet accuracy is not guaranteed.
Additional information, including management fees and expenses, is provided on our Form ADV Part 2 available upon request or at the SEC’s Investment Adviser Public Disclosure website.
Past performance is not a guarantee of future results. Please note that due to rounding differences, certain data presented may not sum to 100%.
The investments presented are examples of the securities held, bought and/or sold in Lincoln Capital Corporation strategies during the last 12 months. These investments may not be representative of the current or future investments of those strategies. You should not assume that investments in the securities identified in this presentation were or will be profitable. We will furnish, upon your request, a list of all securities purchased, sold or held in the strategies during the 12 months preceding the date of this presentation. It should not be assumed that recommendations made in the future will be profitable or will equal the performance of securities identified in this presentation. Lincoln Capital Corporation or one or more of its officers or employees, may have a position in the securities presented, and may purchase or sell such securities from time to time.

