February Changes
Tax Deferred
(for mobile swipe left to right)
| New Additions | Complete Sales | Partial Sales | Additional Buys | % of Account Traded |
|---|---|---|---|---|
| None |
Taxable
(for mobile swipe left to right)
| New Additions | Complete Sales | Partial Sales | Additional Buys | % of Account Traded |
|---|---|---|---|---|
| None |
Summary of Month’s Action:
The S&P 500 declined 2.4% in February, giving back a portion of January’s gains. The only characteristic showing any outperformance for the month was smaller capitalization equities. The information technology sector posted a positive performance in February, while energy, utilities and real estate were the biggest laggards.
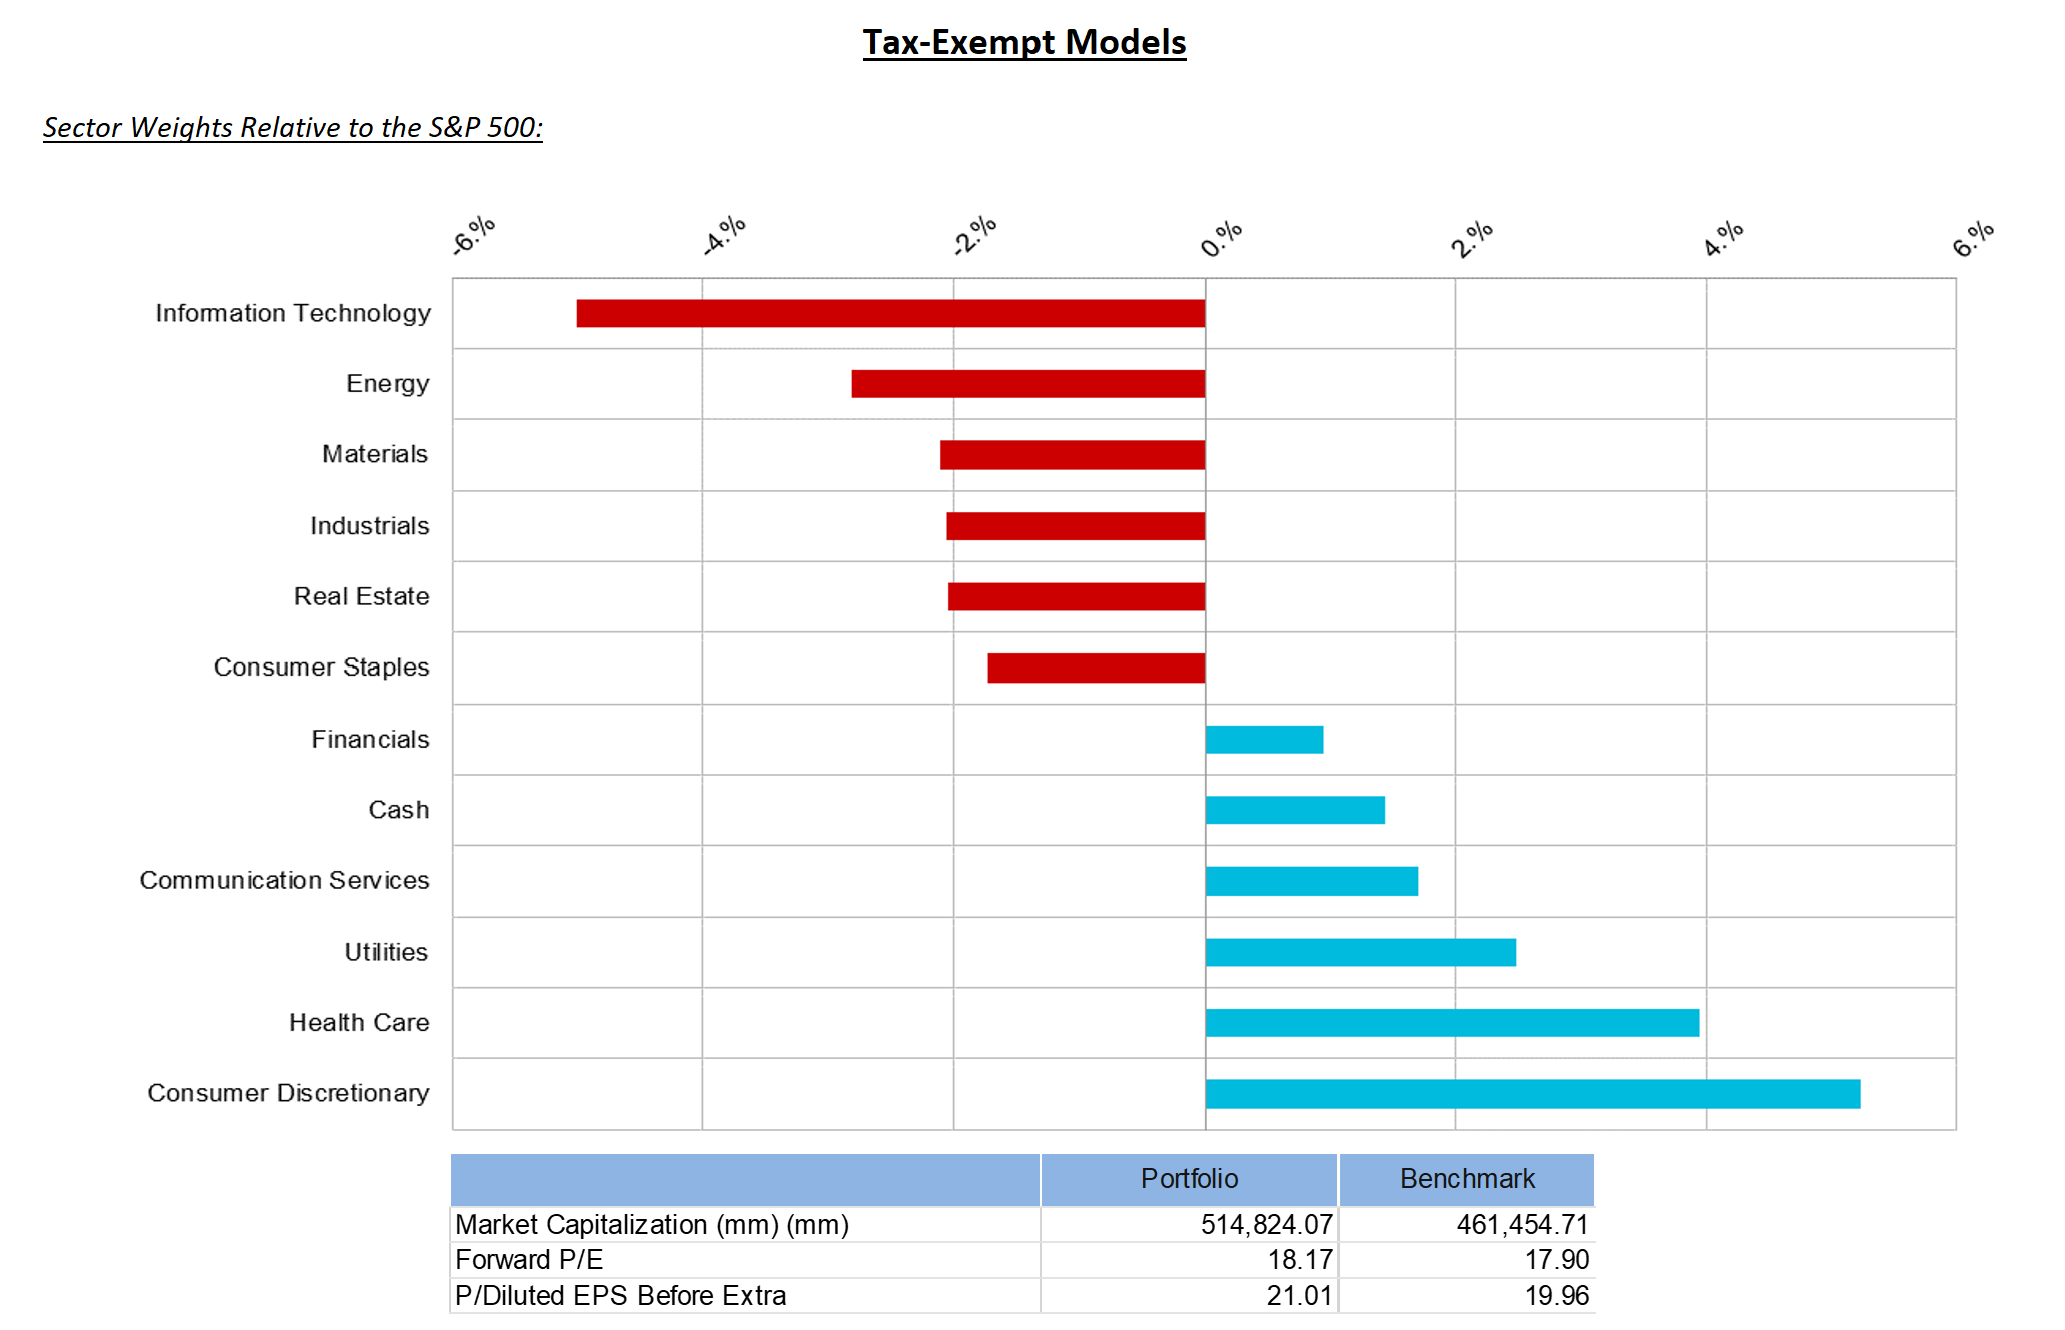
Lincoln Capital’s tax-exempt model underperformed in February. The biggest detractors from relative performance for the month were not owning NVIDIA and Tesla, each of which increased by more than 18%. JPMorgan, Advanced Micro Devices and Charles Schwab all helped performance, each with positive, though unspectacular gains. It has thus been a difficult year for Lincoln Capital’s portfolio. For 2023 to date, large positions in UnitedHealth and Dollar General have been the biggest detractors, while again, not owning Tesla and NVIDIA round out the top four relative performance drags. In general, we attribute the bulk of the underperformance to our defensive positioning.
Momentum stocks – those that have performed the best over the past year – have performed the worst recently. This made sense in January as there was growing evidence of disinflation and the prospect of a softening Fed. However, throughout February, inflation has been firmer across the globe and interest rate expectations pressed to recent highs. At the start of February, the market placed a 1.5% probability that the Federal Funds rate would be above 5% by year’s end; today, that probability is 96%, along with a 40% chance it rises above 5.5%. It is puzzling why momentum stocks would do poorly in both dovish and hawkish environments.
Why A Defensive Stance Remains Prudent
Looking ahead, we believe maintaining our defensive stance – with overweights in health care, utilities, and a large Dollar General position – makes sense for two reasons:
The first reason is that there are more attractive valuations for defensive equities. For example, XLU, the S&P 500 Utilities ETF, traded at a premium valuation to the market last year, as investors paid up for the certainty of regulated earnings and dividend growth. Today, XLU trades at a discount to the market. Similarly, Dollar General traded at a 25% premium in 2022 versus a 6% premium today. Both XLU and DG are likely to grow earnings no matter the economic environment in 2023.
Secondly, it is tough to see the market post abnormally strong returns in 2023, while downside risks remain. Equity returns can be deconstructed into dividend yield, multiple expansion/contraction and earnings growth. The S&P 500’s dividend yield is 1.8%—that’s the easy one. The forward P/E multiple is 17.7x, which is in-line with its five-, ten-, and twenty-year average (18.5x, 17.2x, and 16.3x, respectively). Interest rates and earnings growth are key inputs to valuation multiples. It is difficult to say the next 5-year earnings growth profile for the market will be better than the last. More importantly, government bond yields haven’t been this high since before the financial crisis. Given this, the case for a higher multiple is difficult, while a lower multiple seems more likely.
The last part of the equation is earnings, and there the outlook is also underwhelming. For 2023, analysts are expecting 2% EPS growth from the S&P 500. Earnings surprises have been narrower than history and intra-quarter estimate revisions have been worse than average. As we move through the year, negative EPS growth for 2023 will be an increasingly likely outcome.
Hopefully these details provide insight into our defensive positioning. We will not be dogmatic in this stance and will continue to monitor incoming data closely.


