
Market Activity
Equity markets extended their gains through the third quarter. The S&P 500 rose 8.1%, building on momentum from earlier in the year as corporate earnings proved resilient and inflation remained contained. While Q1 2025 saw non-Magnificent 7 stocks in the S&P 500 outperform, this trend was short lived. As the market rebounded from its April lows, the largest firms continued the outperformance that has become quite familiar. The equal-weighted S&P 500 underperformed the market capitalization weighted index by more than 3% during the third quarter.
International equities posted gains though relative leadership was mixed. Developed market equities lagged S&P 500, while emerging market indices did better during the quarter. International equities’ outperformance year-to-date has been driven mainly by a weakening dollar which is down 9.5% this year (aiding U.S. investor returns on foreign securities are a stronger Euro, Yen and Pound that may be re-converted into more U.S. Dollars).
Fixed income delivered modest positive returns. Treasury yields were volatile but ultimately ended the quarter lower, with the 10-year U.S. Treasury finishing September at 4.16%. Credit markets remained stable, with spreads tight and defaults contained, underscoring confidence in corporate fundamentals.

Economic Activity
The economy continued to show resilience, with real GDP expanding at an annualized rate of 3.8% in Q2. However, much of this gain reflected inventory restocking and trade dynamics. Final sales to domestic purchasers grew closer to 2.9%, more in line with long-term potential. This strength continued through the third quarter, with the Atlanta Fed’s GDP Now estimate pointing to 2.8% growth (excluding net exports and inventory changes).
As with most things these days, GDP can’t be explained without talking about artificial intelligence (AI). More specifically, the need for data center capacity to house and deliver AI services is believed to be responsible for close to half of all economic growth in the U.S. Capital expenditures of just four hyperscalers (Microsoft, Meta, Amazon, Alphabet (Google)) are projected to grow 48% in 2025 and approach $400 billion.
Labor market conditions continued to cool. From May through September, payroll gains slowed to an average of 26,800 per month, while job openings declined to roughly 7.2 million — well below recent highs. The unemployment rate edged higher to 4.3% in August, signaling a more balanced job market, though still below the 50-year average of 6.1%, yet above the recent low of 3.4%. Unfortunately, due to the government shutdown, the regularly scheduled payrolls report has been delayed. While the government report is considered the gold standard, ADP’s survey showed weakness continuing into September.
Monetary Policy
The Federal Reserve cut rates by 25 basis points at its September meeting, lowering the target range to 4.00%–4.25%. Policymakers acknowledged progress on inflation yet emphasized the need for greater confidence that price stability will be sustained. The Fed continues to balance the risks of cutting too early against the possibility of overtightening. Market expectations now anticipate two additional rate cuts in 2025, with the Feds Fund rate dropping below 3.0% as we exit 2026.
Last quarter we wrote about Fed independence and how President Trump would approach his nomination of a new Chairman in 2026. Due to recent events, this issue is still front and center for investors. Ultimately, the loss of Fed independence would likely mean higher growth, higher inflation, lower than necessary short-term interest rates, and higher long-term interest rates – not a desirable mix.
Valuation and Sentiment
Asset valuations remain elevated relative to history. The forward P/E ratio for the S&P 500 ended September at nearly 23x compared with a 30-year average of 17x. While historical multiples are important, earnings expectations for 2025 and 2026 are based on double-digit profit growth which would appear to be highly supportive of asset valuations.
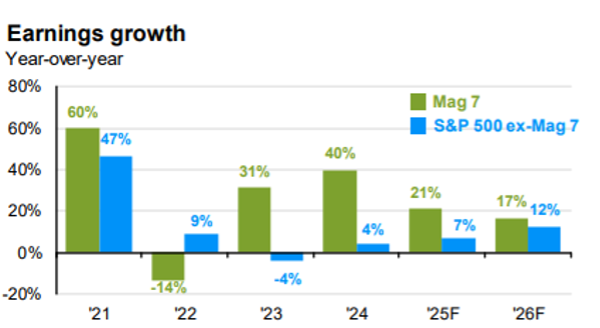
Concentration remains an important theme, with the top 10 companies in the index trading at nearly 30x forward earnings, compared with under 20x for the remainder. While these statistics can be alarming, it’s important to remember the fundamentals in addition to the valuation. The ‘other 493’ companies were expected to grow second quarter earnings 2.5% as of June 30th. As results rolled in, this figure ended closer to 8.1%. The Magnificent 7 were expected to grow earnings 13.9% for the quarter when, in actuality, EPS grew by 26.6%. This group clearly deserves a premium valuation based on near-term and long-term economic and financial measures.
The Investment Outlook
With the Fed expected to lower interest rates two more times this year, and with like-minded central banks continuing policies to stimulate economic activity, savers and investors will continue to seek increasing returns which will require moving further out on the risk spectrum. Comparisons of AI today versus the Tech bubble in the late 1990s have overlapping dynamics.
A Brief Overview of the Dot-Com Bubble – Rise and Fall (late 1990s-2002) –
- The Dot-Com Bubble emerged in the mid-1990s, fueled by the rapid buildout of the internet and the rise of web-based businesses.
- Venture capital flooded into startups with “.com” in their names, often regardless of profitability or viable business models.
- The Nasdaq Composite Index, heavily weighted with tech stocks, soared sevenfold from 743 in 1995 to a peak of 5,048 in March 2000.
- Investor mania embraced the idea that traditional metrics—like earnings, assets, and cash flow—were outdated for valuing internet companies.
- Many startups went public via IPOs, generating massive capital despite having little revenue or product viability.
- By late 2000, reality set in as most dot-coms lacked sustainable business models and burned through capital without turning profits.
- The bubble inevitably burst as evident with the Nasdaq dropping 80% from its prior high by October 2002.
- High-profile failures included Pets.com, Webvan, Boo.com, and telecom giants WorldCom and Global Crossing
- Companies that survived and weathered the storm – like Amazon and eBay – eventually thrived thanks to solid business models and market niches.
- The crash led to more disciplined investing and a shift toward profitability and sustainability in tech.
- Infrastructure built during the bubble—like fiber optics and web platforms—laid the groundwork for future innovations, including social media and cloud computing.
Outlook Summary: While the bullet points above may sound familiar to the market zeitgeist of today, there are significant differences between AI and the dot.com technology of yesteryears. Unlike the year 2000, a significant amount of the capital required to fund these technologies is sourced from company’s free cash flows. If AI were to underwhelm today’s expectations, this would be capital wasted, yet Microsoft, Google, Meta, Amazon, et al. would still have their core businesses intact. Unlike many of the firms that realized outsized valuation during the dot-com boom, OpenAI has $13 billion in annual revenue and 800 million weekly active users.
Lastly, we ask “Can there be an AI bubble while there is so much talk of bubbles?” While this may sound like double-talk, it is an interesting question to ponder. Let us review a recent example – the recent Oracle bond sale. Oracle is building out its infrastructure to support its recently signed computing deal with OpenAI. Unlike peers, Oracle will need outside capital to achieve its vision. The company recently raised $18 billion from bond investors after receiving bids of more than $88 billion. While investors debate an AI bubble, their actions imply little concern.
Our base case expectation is for AI to be a world-changing technology, and the huge investment spending will prove to be justified. However, given numerous signs of froth and investor exuberance, we continue to position portfolios to participate in ascending markets while doing so in a defensive manner.
Tax Impact of The One Big Beautiful Bill
Signed into law on July 4th, President Trump’s One Big Beautiful Bill (OBBB) introduced changes ranging from immigration to government assistance to energy funding, to name a few. Some of the more significant changes came with tax laws that will impact nearly all individual taxpayers. According to data from the Tax Foundation, the new law extends or makes permanent most of the tax cuts enacted in 2017 and adds new deductions and increased tax credits. While some changes take effect immediately, others begin in 2026 and beyond. Continue reading for a summary of key provisions affecting individuals.
- At the centerpiece of the bill is the permanent extension of the 2017 Tax Cuts and Jobs Act (TCJA), which was set to expire at the end of the year. This included lower individual income tax rates across all federal brackets, a higher standard deduction, an increase to the federal child tax credit to $2,200 (from $2,000) for 2025, and an increase of the estate tax exemption to $15 million beginning in 2026.
- One of the most debated provisions of the TCJA was the state and local tax (SALT) deduction. Under the TCJA, the cap was $10,000, but under the OBBB, taxpayers can deduct up to $40,000 of SALT, through 2029. This phases down for couples with a modified adjusted gross income (MAGI) greater than $500,000.
- The new bill eliminates tax on cash tip income for eligible workers up to $25,000 per year, beginning in 2025 through 2028. This benefit phases out for individuals earning more than $150,000. There is also no federal tax on overtime pay up to $12,500, through 2028.
- While not eliminating taxes completely on Social Security as the administration had hoped, taxpayers aged 65 and older will receive an extra $6,000 deduction, applicable to those who itemize or take the standard deduction. MAGI must be less than $75,000 per individual or $150,000 per couple.
In addition to the above, the OBBB included provisions expanding the use of 529 accounts, winds down most of the tax credits related to green energy- including EV autos and energy efficient homes- and the creation of a $1,000 tax credit for opening a “Trump” account for a child born between January 1, 2025 and December 31, 2028.
A tax professional should be consulted on the impact of these changes to your tax return. As always, please contact us if we may be of assistance in any manner.
DISCLOSURES – This presentation is not an offer or a solicitation to buy or sell securities. The information contained in this presentation has been compiled from third party sources and is believed to be dependable; however, its accuracy is not guaranteed and should not be relied upon in any way whatsoever. This presentation may not be construed as investment advice and does not give investment recommendations. Any opinion included in this report constitutes the judgment of Lincoln Capital Corporation as of the date of this report and are subject to change without notice. Additional information, including management fees and expenses, is provided on Lincoln Capital Corporation’s Form ADV Part 2. As with any investment strategy, there is potential for profit as well as the possibility of loss. Lincoln Capital Corporation does not guarantee any minimum level of investment performance or the success of any portfolio or investment strategy. All investments involve risk (the amount of which may vary significantly) and investment recommendations will not always be profitable. The investment return and principal value of an investment will fluctuate so that an investor’s portfolio may be worth more or less than its original cost at any given time. The underlying holdings of any presented portfolio are not federally or FDIC-insured and are not deposits or obligations of, or guaranteed by, any financial institution. Past performance is not a guarantee of future results. Lincoln Capital Corporation prepare presentation, 401.454.3040, www.lincolncapitalcorp.com Copyright © 2026, by Lincoln Capital Corporation.