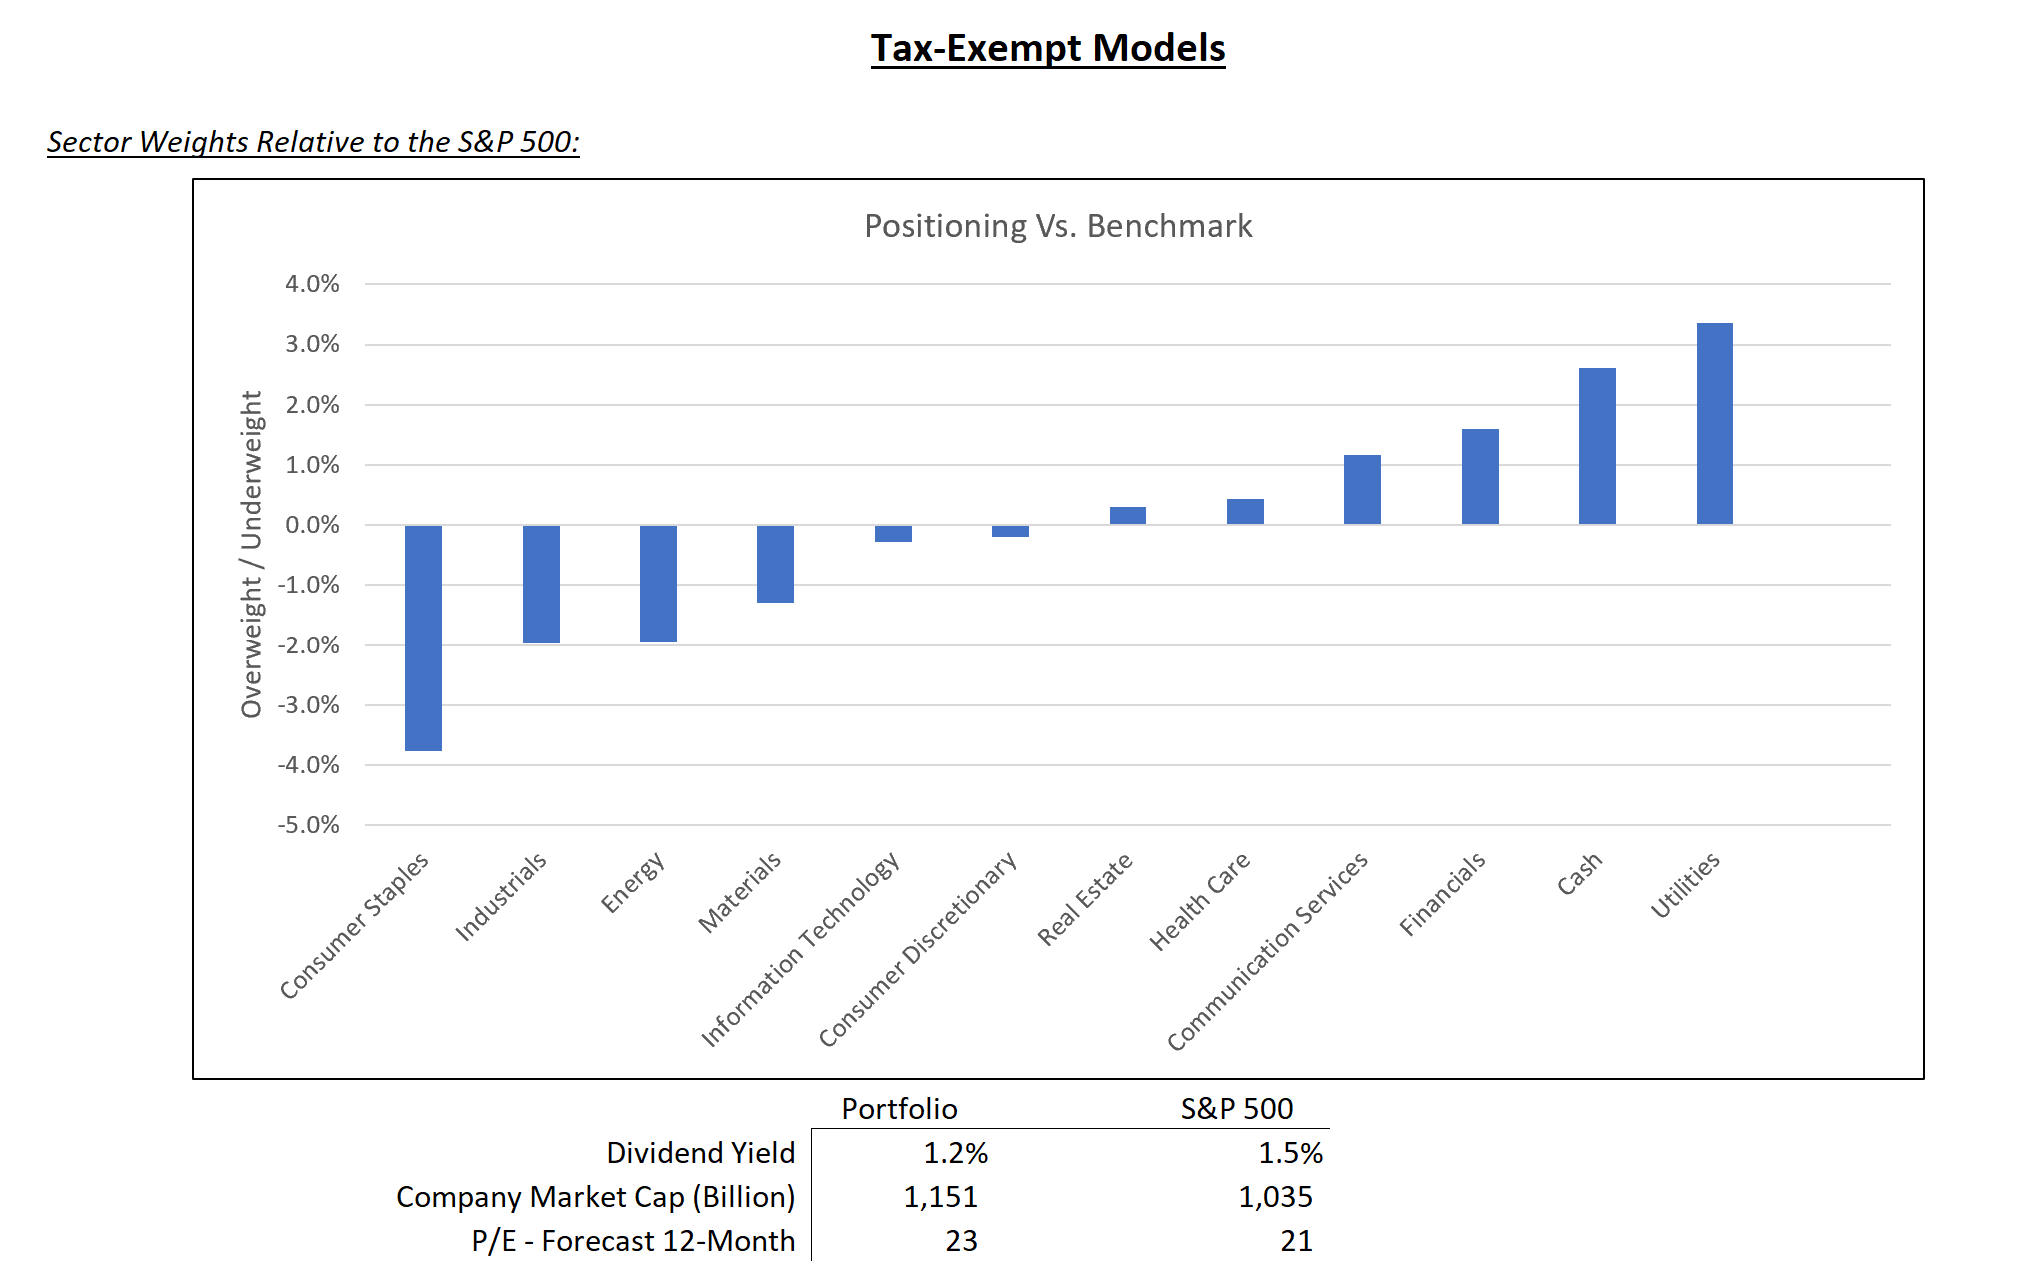
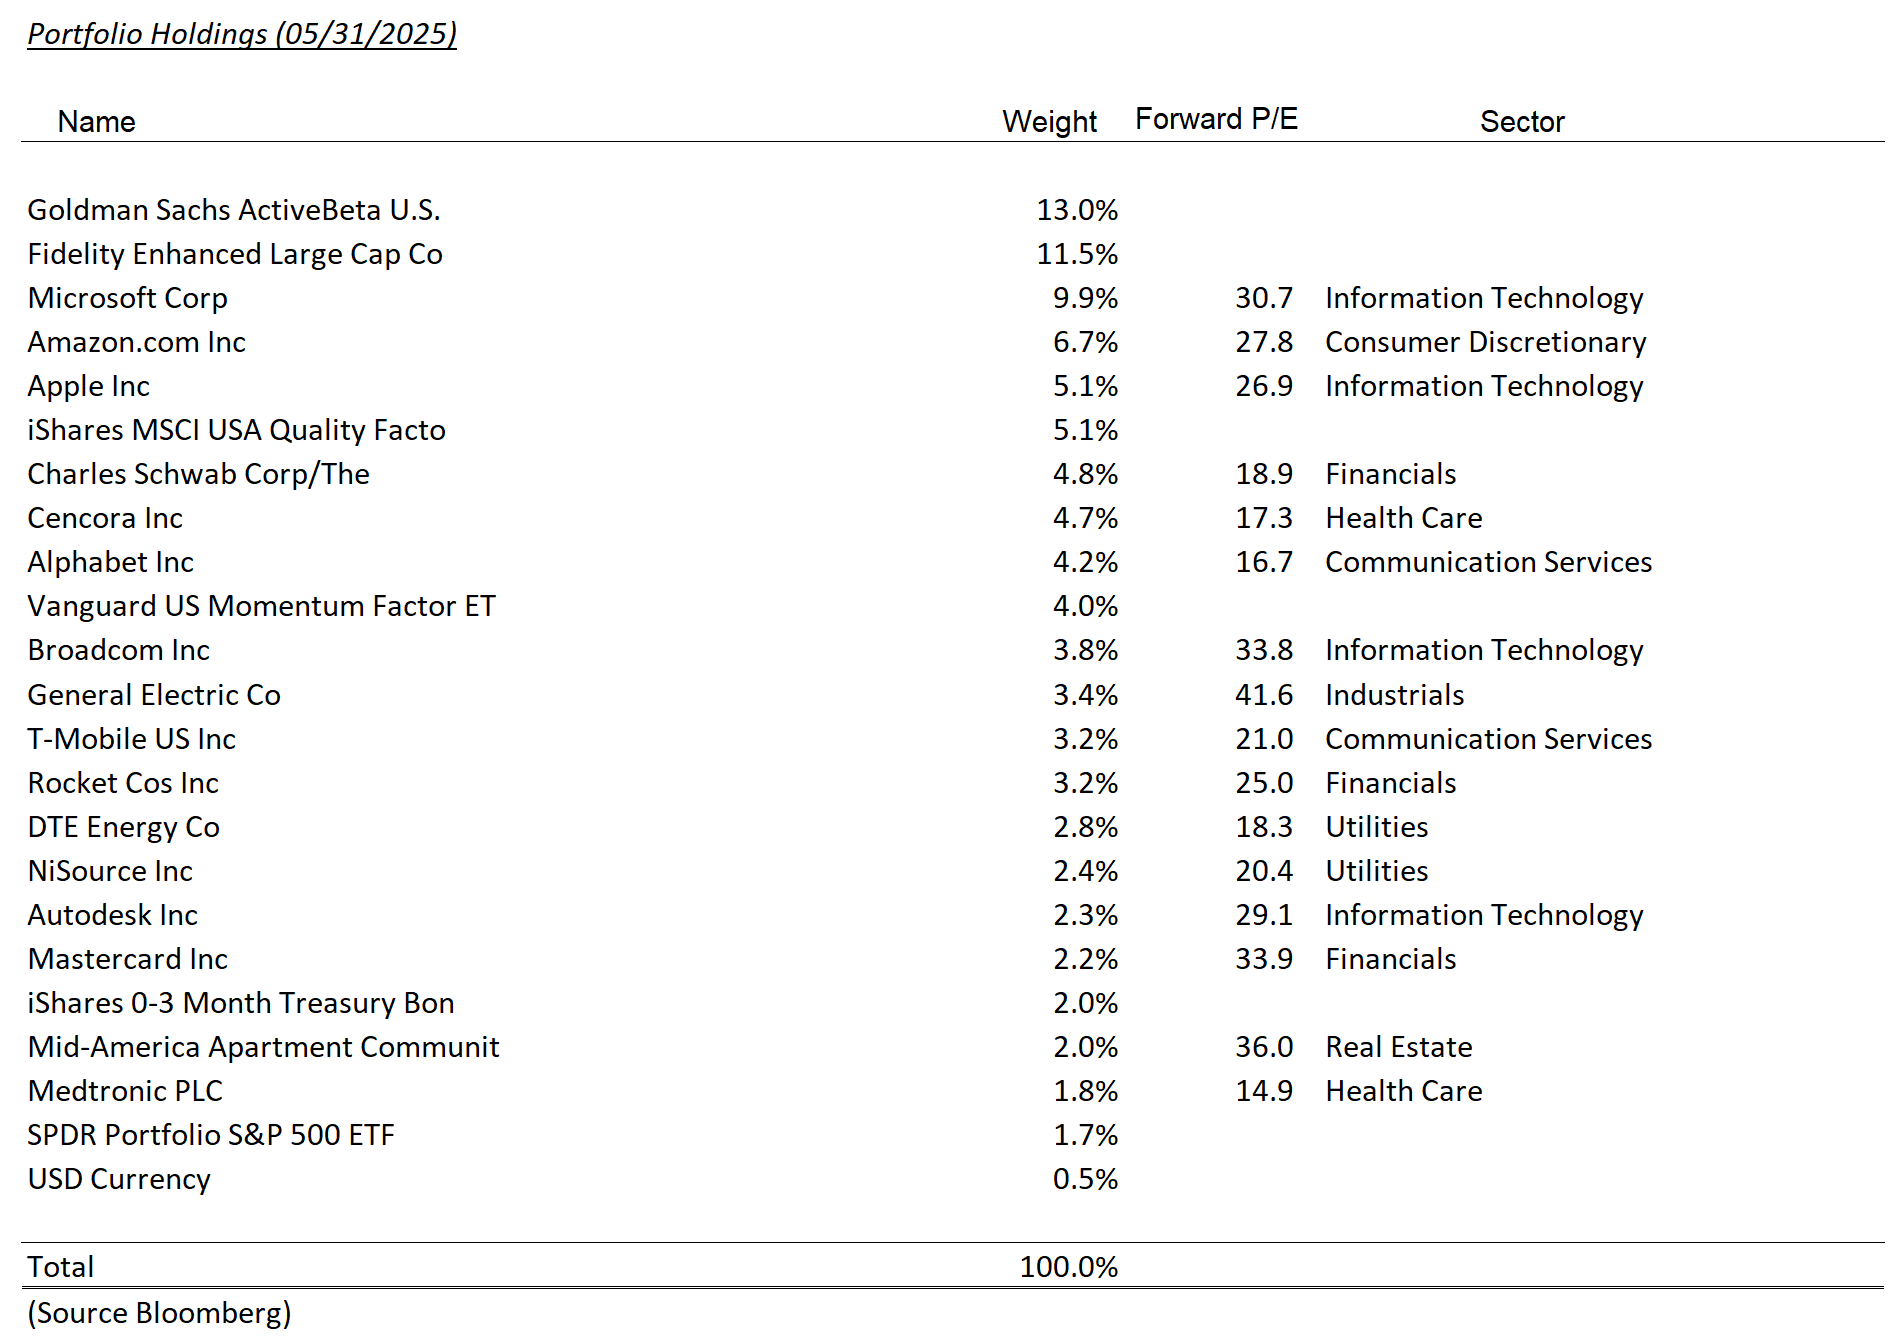
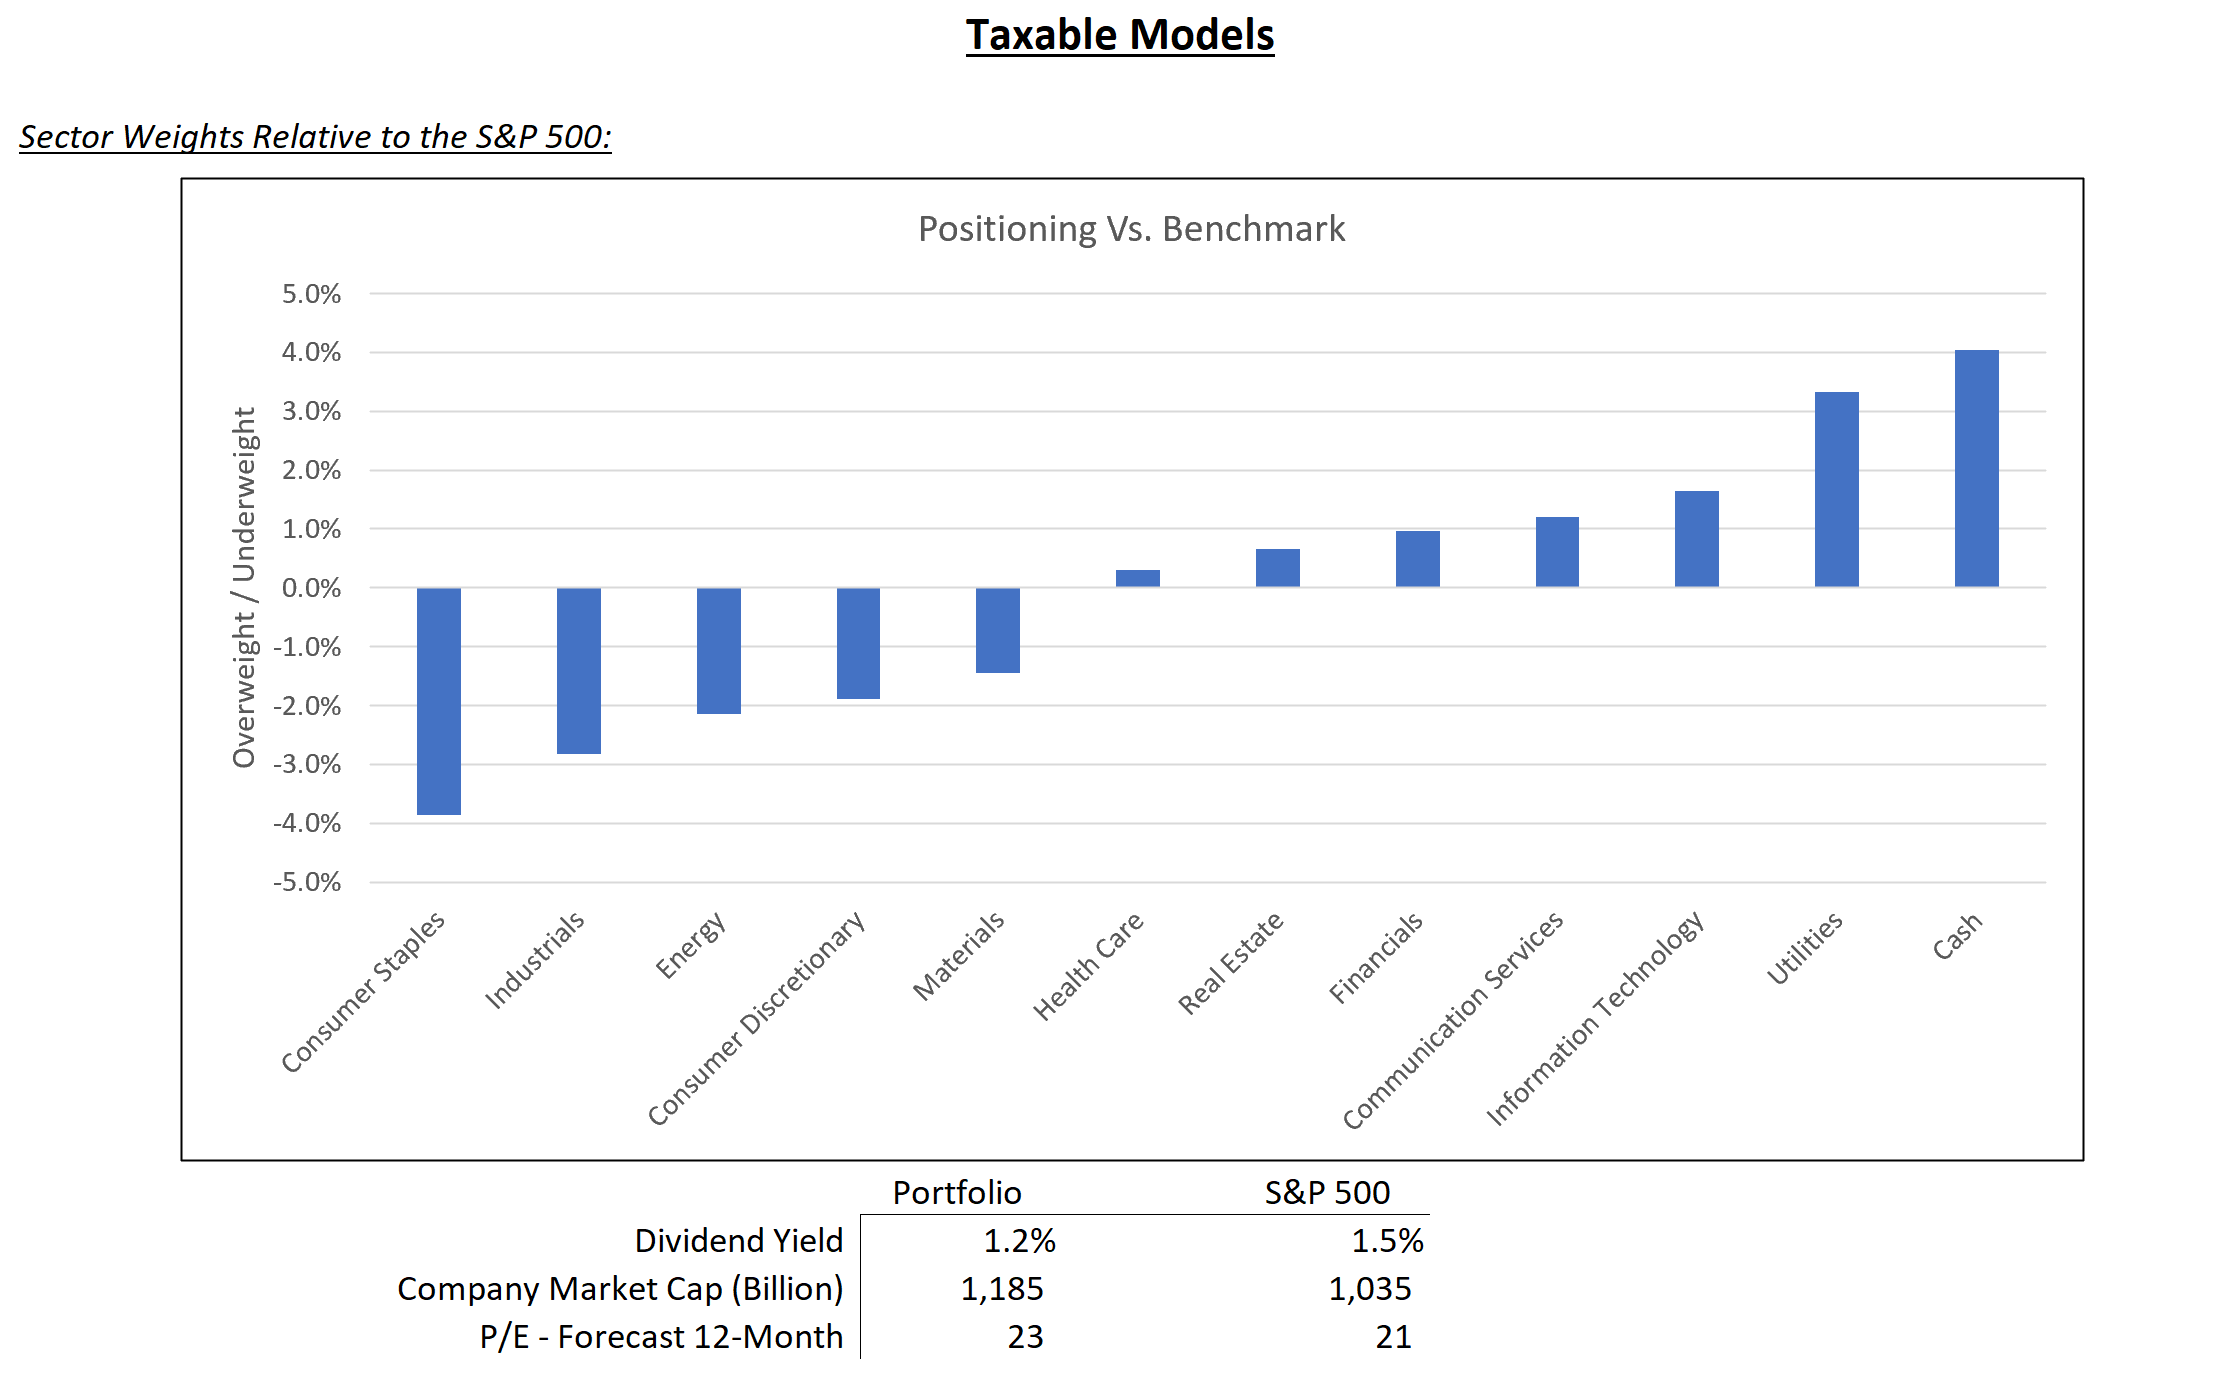
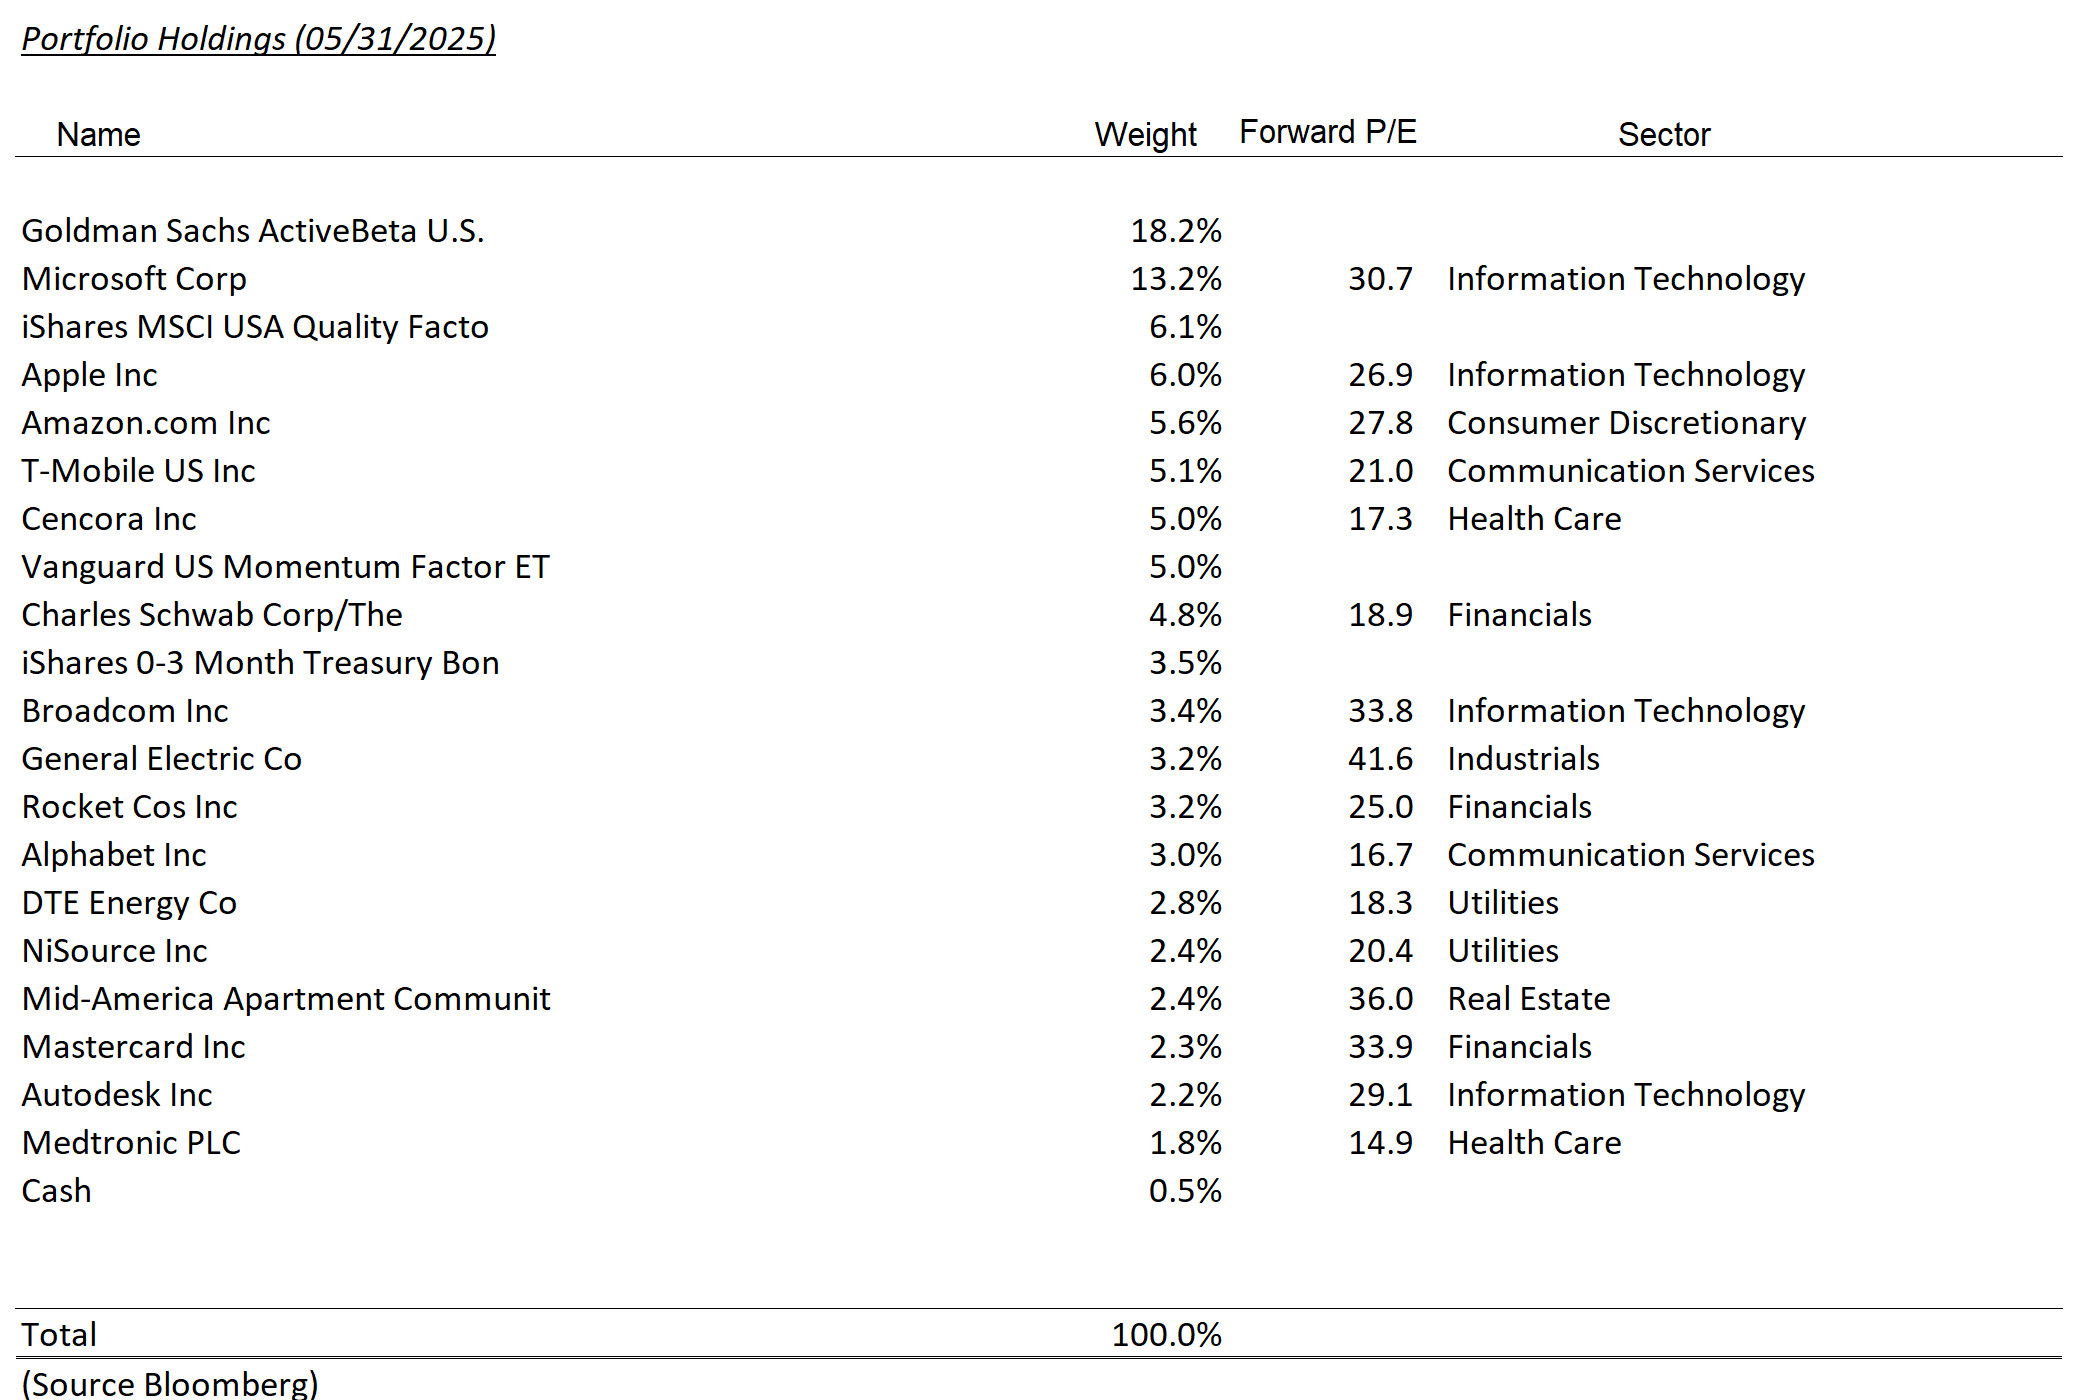
May Changes
Tax Deferred
(for mobile swipe left to right)
| New Additions | Complete Sales | Partial Sales | Additional Buys | % of Account Traded |
|---|---|---|---|---|
| ADSK | 2.3% | |||
| UNH | 2.3% | |||
| MRVL | 2.3% | |||
| AAPL | 2.0% |
Taxable
(for mobile swipe left to right)
| New Additions | Complete Sales | Partial Sales | Additional Buys | % of Account Traded |
|---|---|---|---|---|
| ADSK | 2.2% | |||
| UNH | 2.3% | |||
| AAPL | 0.7% |
Summary of Market Activity
U.S. equities had a strong showing in May, with the S&P 500 rising over 6% for the month. Investor sentiment improved notably as it became increasingly clear that the worst of the tariff-related announcements may now be behind us.
We share the market’s view that, while recent flare-ups—including threats toward the European Union and concerns about China’s commitment to the current standstill—have raised short-term uncertainty, the broader trend appears to be one of easing trade friction. That said, we still expect the final outcome to include a higher overall tariff level than where the year began.
Looking ahead, attention is turning to the administration’s proposed “big beautiful bill,” targeted for signing on July 4th. If approved and met favorably by the bond market, this legislation could offer meaningful stimulus for both the economy and equity markets.
Top Contributors and Detractors
Key drivers of performance during May included Microsoft, General Electric, and Broadcom, each of which posted monthly gains exceeding 15%. Meanwhile, UnitedHealth, Cencora, and T-Mobile were the primary laggards.
*All figures sourced from Bloomberg. Please note that due to rounding differences, certain data presented may not sum to 100%.


Disclosures
The views expressed represent the opinions of Lincoln Capital Corporation as of the date noted and are subject to change. These views are not intended as a forecast, a guarantee of future results, investment recommendation, or an offer to buy or sell any securities. The information provided is of a general nature and should not be construed as investment advice or to provide any investment, tax, financial or legal advice or service to any person. The information contained has been compiled from sources deemed reliable, yet accuracy is not guaranteed.
Additional information, including management fees and expenses, is provided on our Form ADV Part 2 available upon request or at the SEC’s Investment Adviser Public Disclosure website.
Past performance is not a guarantee of future results. Please note that due to rounding differences, certain data presented may not sum to 100%.
The investments presented are examples of the securities held, bought and/or sold in Lincoln Capital Corporation strategies during the last 12 months. These investments may not be representative of the current or future investments of those strategies. You should not assume that investments in the securities identified in this presentation were or will be profitable. We will furnish, upon your request, a list of all securities purchased, sold or held in the strategies during the 12 months preceding the date of this presentation. It should not be assumed that recommendations made in the future will be profitable or will equal the performance of securities identified in this presentation. Lincoln Capital Corporation or one or more of its officers or employees, may have a position in the securities presented, and may purchase or sell such securities from time to time.

